Skip to content
DataRich
Search for:
Search
Menu
Home
Data Themes
Population
Population Profile
Population Explorer
Languages
Deprivation
Deprivation Profile
Indices of Deprivation 2025
Crime & Community Safety
Health & Social Care
Children, Young People & Education
Economy & Employment
Environment
Environment Profile
Climate Risk Map
Equalities
Housing
Census Housing profile
UK House Price Index
Data Explorer
Custom Area Reporter
Census 2021
Cost of Living Data
Digital Exclusion
Reports
Public Health Reports
Links & Resources
Links & Resources
Help & Guidance
About
How To
Guide to Geography
FAQs
Accessibility
Contact Us
Previous Image
Next Image
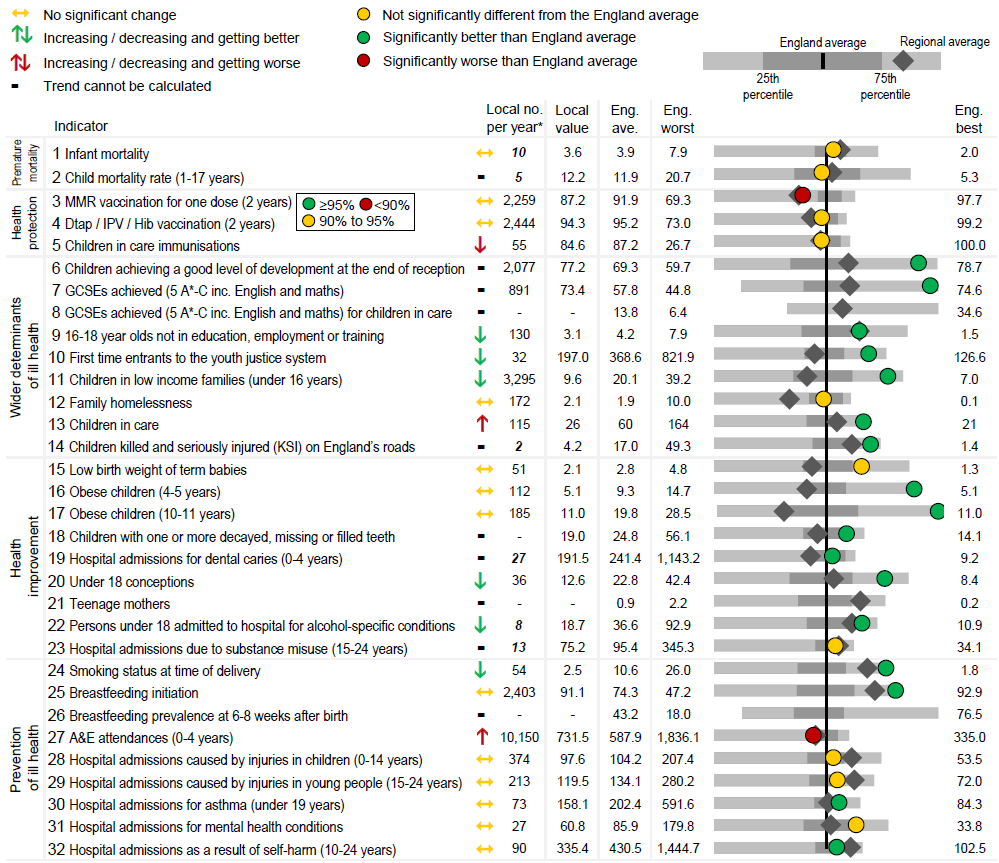
Spine Chart
Leave a Reply
Cancel reply
You must be
logged in
to post a comment.
Post navigation
Published in
Spine Chart
DataRich
uses cookies to enhance your use of this site.
You can read about the cookies we use here
.
OK, I accept all cookies
Only use essential cookies