The most recent Census was conducted on 21 March 2021 to collect information about the population and how we live. The Census figures can help with decisions about how funding and resources are used by public services. The Office for National Statistics (ONS) started releasing data in stages on 28 June 2022 and you can find more information about their Census 2021 timeline on the ONS website.
Census 2021 Analysis
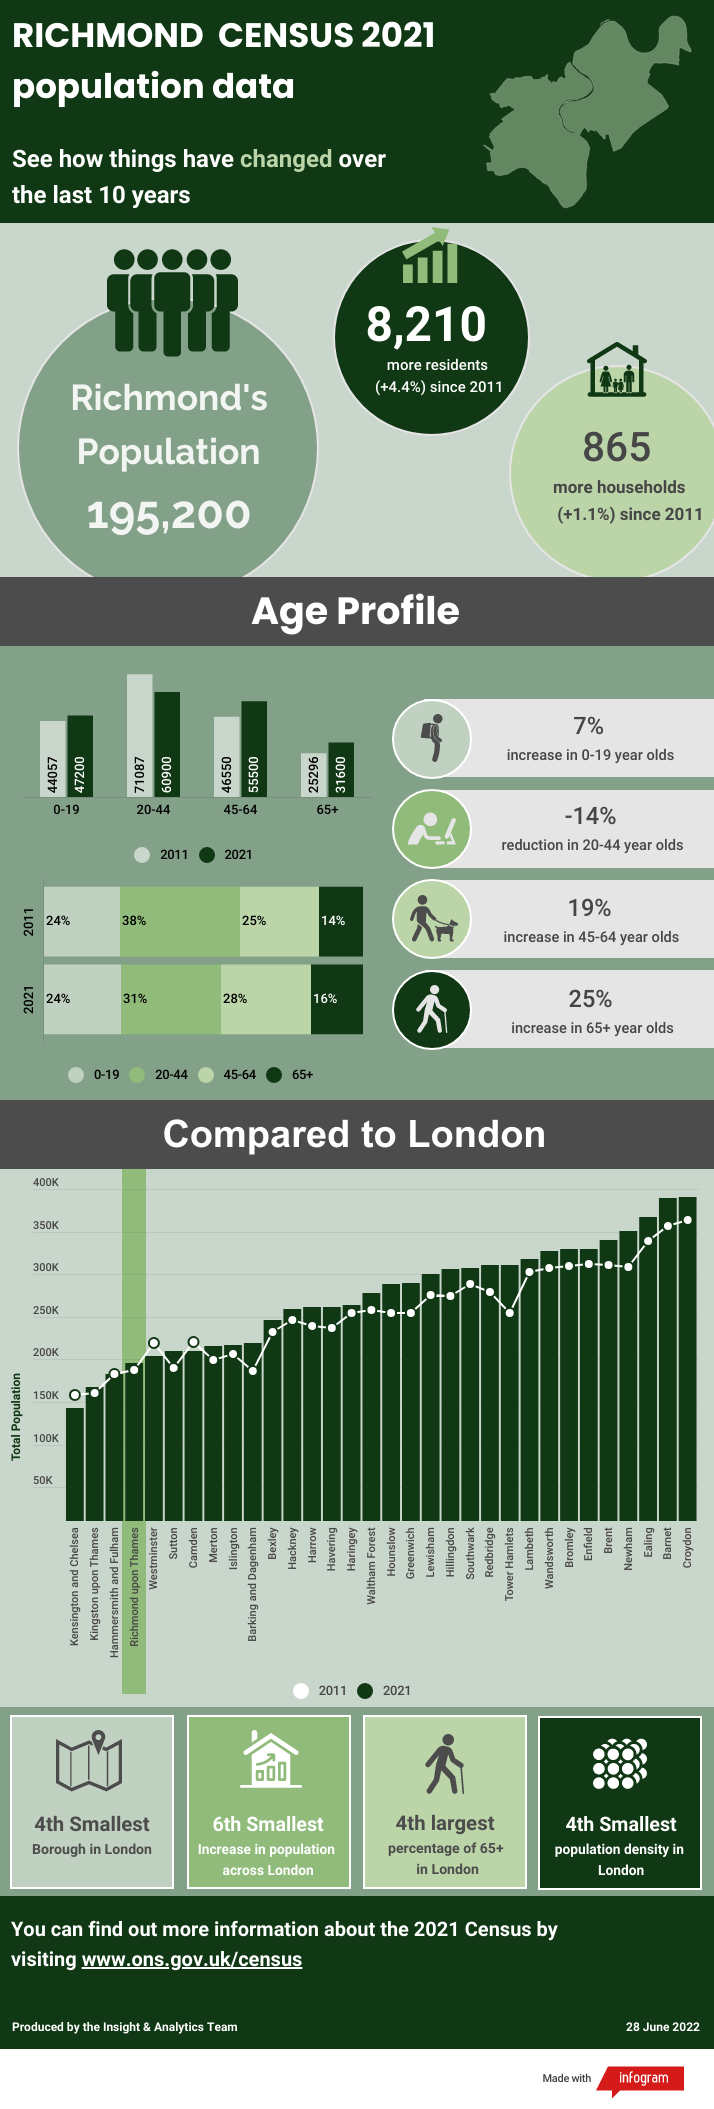
The report produced by the Insight and Analytics team for the Census 2021 data from the Office for National Statistics (ONS) contains analysis of population change and all topic summaries is available below in PDF format. The report provides details of how the population of Richmond upon Thames has changed between 2011 and 2021, as well as providing comparisons to London and England.
Census 2021 initial analysis of Richmond upon Thames (PDF)
Interactive Census Maps
The Office for National Statistics (ONS) have created an Interactive map that allows you to explore what people’s lives were like across England and Wales in March 2021. It allows you to view proportions of the population for specific topics and the percentage point change since 2011 by changing the mode:
Build a custom area profile
The ONS have also produced a tool to ‘Build a custom profile’ visualisation. This allows you to search for a specific borough or ward by typing it into the ‘Find an area or postcode’ box and then allows you to build a profile based on your selected area. There are 34 different indicators that can be included in the report and although England is used as the default comparison option this can be changed for a more local comparison.
Build a custom area profile “Select an area and build a profile based on Census 2021 data”
OFFICE FOR NATIONAL STATISTICS (ONS) – Census 2021 facts and figures for people living in Richmond
NOMIS (provided by the ONS). This website publishes statistics related to population, society and the labour market at national, regional and local levels. This include data from current and previous censuses, which can be downloaded for individual census topics.
NOMIS Topic Summaries – 2021 Census
OFFICE FOR NATIONAL STATISTICS (ONS) – Census 2021 rounded population and household estimates for local authorities in England and Wales, by sex and five-year age group.
Population and household estimates, England and Wales: Census 2021
OFFICE FOR NATIONAL STATISTICS (ONS) – An interactive report that looks at which places have seen the biggest increases and decreases, which areas had the largest growth in different age groups, and how your chosen local authority area compares with others.
How the population changed where you live: Census 2021
LONDON DATASTORE – The Greater London Authority analysis of Census releases, working to understand what they mean for London, assessing the quality of the data, and making key information easily available.
Census 2021 Reports (london.gov.uk)
Infographic on population changes