The National End of Life Care Intelligence Network of Public Health England has published end of life care profiles for clinical commissioning groups[1](CCGs). Using Office for National Statistics (ONS) mortality data from 2011 to 2013, the profile gives an overview of variations in cause and place of death, by age and sex, for each CCG in England.
In addition, Public Health England published the report “What we know now 2014”, which provides an update of the information and evidence about end of life care published by the National End of Life Care Intelligence Network and its partners over the past year.
What does this mean for Richmond?
- Since implementation of the End of Life Care (EoLC) Strategy in 2008, the percentage of deaths in hospital has reduced steadily, with a corresponding increase in the percentage of deaths at place of usual residence. By reducing the number of emergency admissions for patients with long-term conditions through provision of out-of-hospital care, it is more likely that they will be able to have a planned death in their preferred place of care such as home, care home or hospice.
- Just over half (51%) of deaths occurred in hospital in Richmond CCG, which is the overall majority setting. This is similar to the England average of 49%. Hospital deaths from long-term conditions such as respiratory disease, CVD and cancer are also similar to the national level.
- 23% of all deaths in Richmond CCG occurred at home, which is similar to the national level (22%).
- Overall the fewest deaths occur in the hospice setting (7%), which is just above the national level (6%). However, hospice deaths for each of the long-term conditions are not significantly different from the England average.
- Richmond CCG has one of the lowest proportions of care home deaths in England and this pattern is reflected for patients dying from cancer, CVD and respiratory disease. However, it should be noted the proportion of care home beds is lower in Richmond compared to elsewhere and the percentage of care home deaths has not been adjusted to account for this.
- The smallest proportion of home deaths is for respiratory disease (17%). Whereas, 29% of cancer and CVD deaths occur at home. None of these are significantly different from the national level.
- Respiratory disease has the largest proportion of hospital deaths (68%), compared to the other long-term conditions. Cancer has the lowest proportion of hospital deaths (40%).
- The gender balance within place of death varies. Richmond follows the national pattern of home deaths being more likely to be male and care home deaths being predominately female (source: “What we know now 2014”).
- Figure1: Deaths in Richmond and England by place of death and gender, 2011-2013
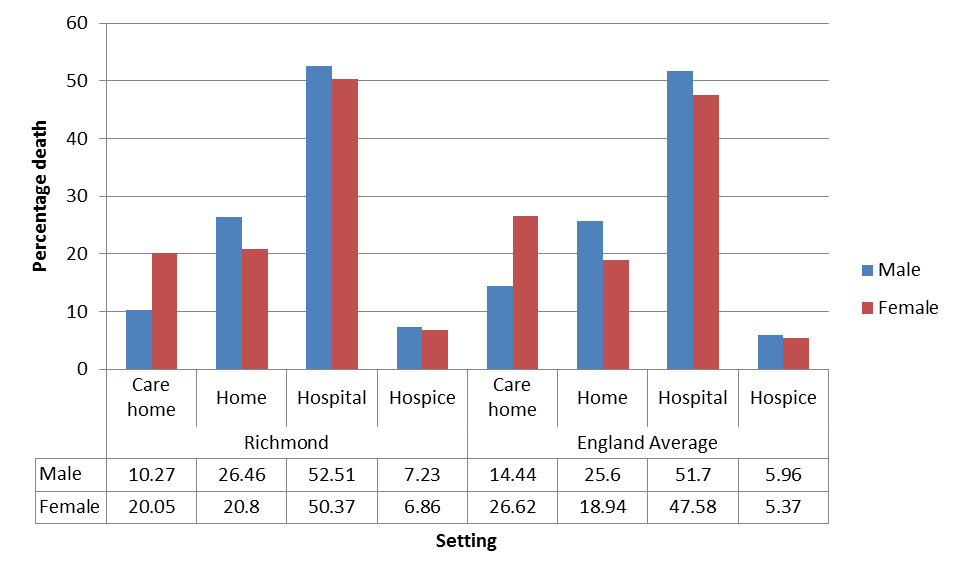
Source: Office for National Statistics processed by Public Health England.
- There is geographical variation in disability-free life expectancy with people in Richmond living a smaller proportion of their lives with a disability. People in Richmond are expected to live nine more years without a disability than those in Newham. Males in Richmond could expect to live one seventh of their lives (13.5%) with a disability, while males in Liverpool could expect to live a quarter of their lives (25.6%) with a disability (source: “What we know now 2014”).
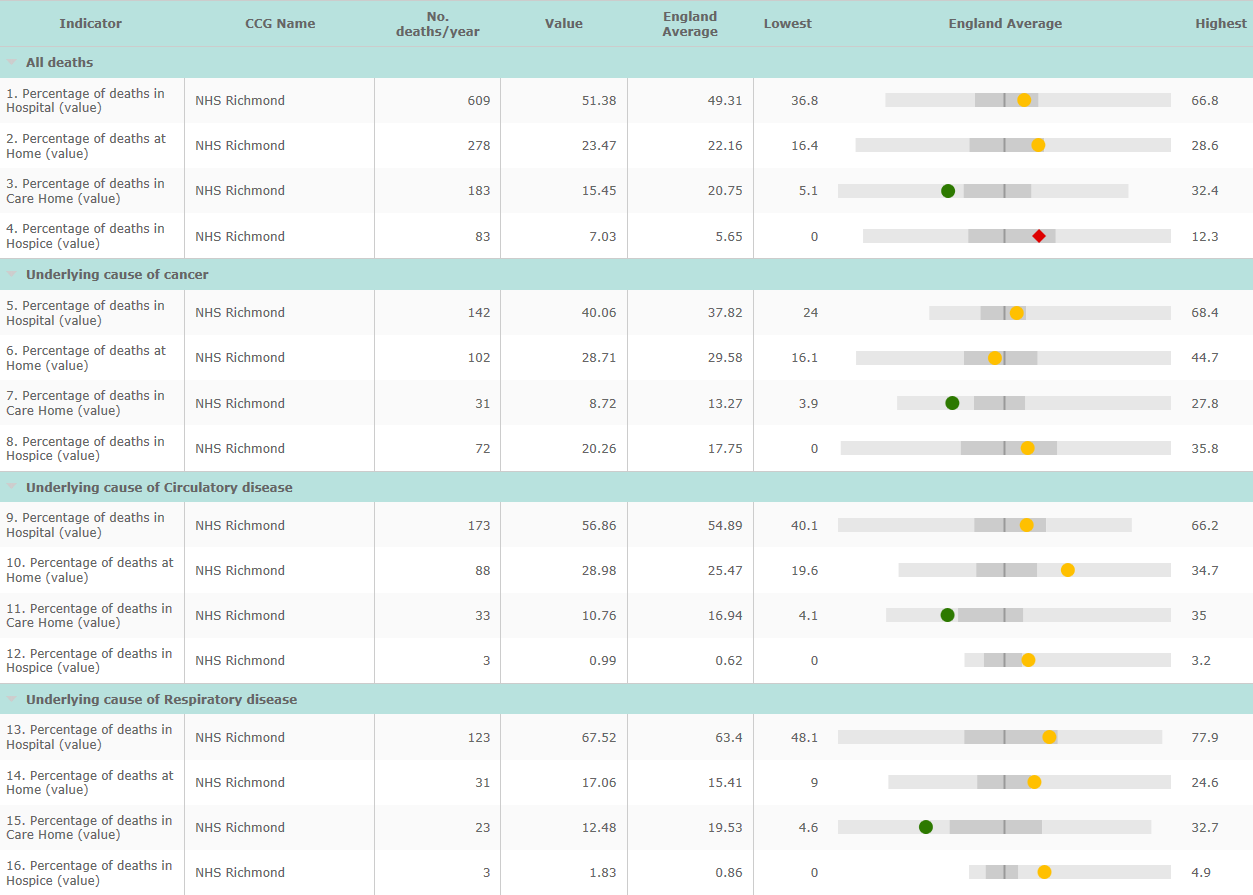
The chart below shows the End of life care profiles for CCGs by place and underlying cause of death. The key is shown below.

[1] Definition of CCG population: patients registered at GP surgery in Richmond. Not exactly the same as resident population in Richmond.