The Office for National Statistics (ONS) has recently published its statistical bulletin ‘Health expectancies at birth by Middle Layer Super Output Areas, England, Inequality in Health and Life Expectancies within Upper Tier Local Authorities: 2009 to 2013.’
The bulletin, and the accompanying data, measure health inequality using the Slope Index of Inequality (SII)[1] within England in the period 2009 to 2013. They include the first published estimates for healthy life expectancy (HLE) and disability-free life expectancy (DFLE) at birth for small areas within England, known as middle layer super output areas (MSOAs)[2].
What does this mean for Richmond?
Key Messages
- As well as being in the top ten for these life expectancy measures, Richmond has one of the smallest gaps in healthy and disability-free life expectancy between the most and least deprived areas in the borough compared to other Local Authorities.
- This should be interpreted in the context of the borough’s lower levels of deprivation– nearly 90% of Richmond residents live in areas that are less deprived than the English average[3].
- However, albeit small compared to elsewhere, there are still striking gaps between the least and most deprived areas in the borough.
- Both males and females who live in the most deprived parts of Richmond can expect almost 7 years less of good health (HLE) than their counterparts in the least deprived parts of the borough.
- The equivalent gap in disability-free life expectancy is 5.9 years for males and 5.1 years for females.
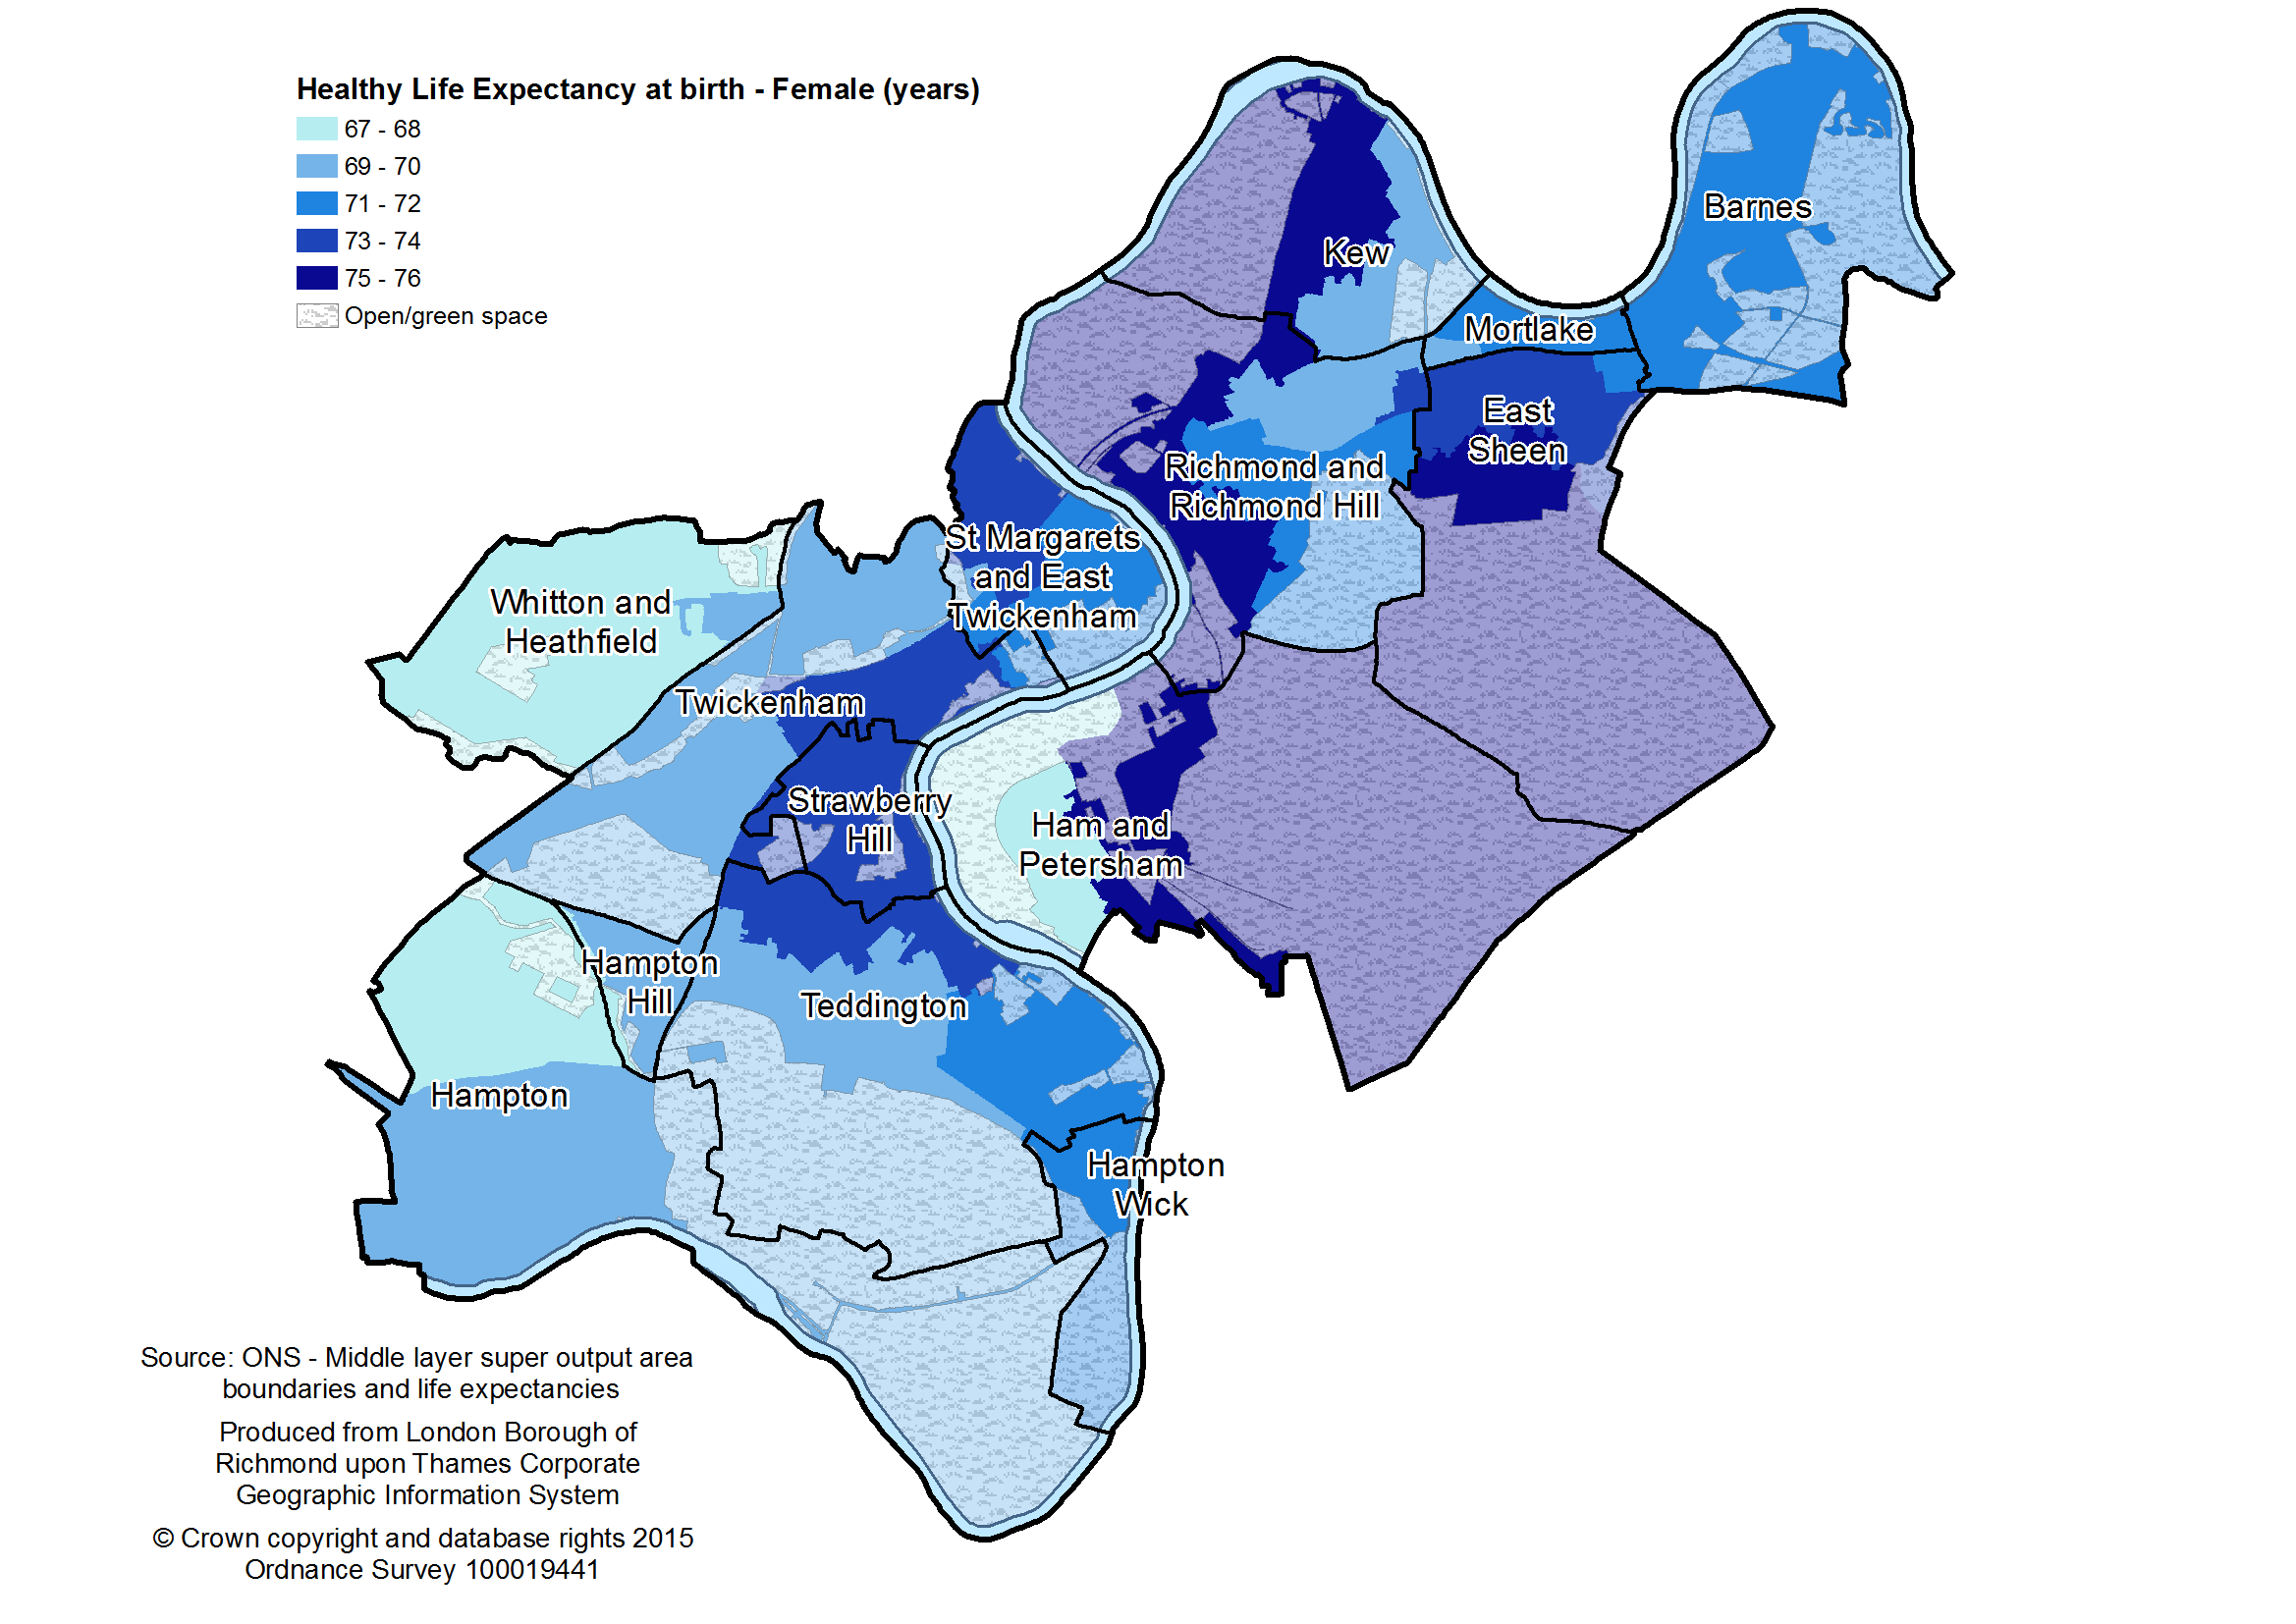
- The maps below show the variation of HLE within Richmond for males and females[4] (figures 1 & 2 respectively). Parts of Whitton & Heathfield, Hampton and Ham & Petersham have the lowest healthy life expectancy compared to other parts of the borough, for both males and females.
Figure 1: Number of years of healthy life expectancy at birth for males, 2009 – 2013
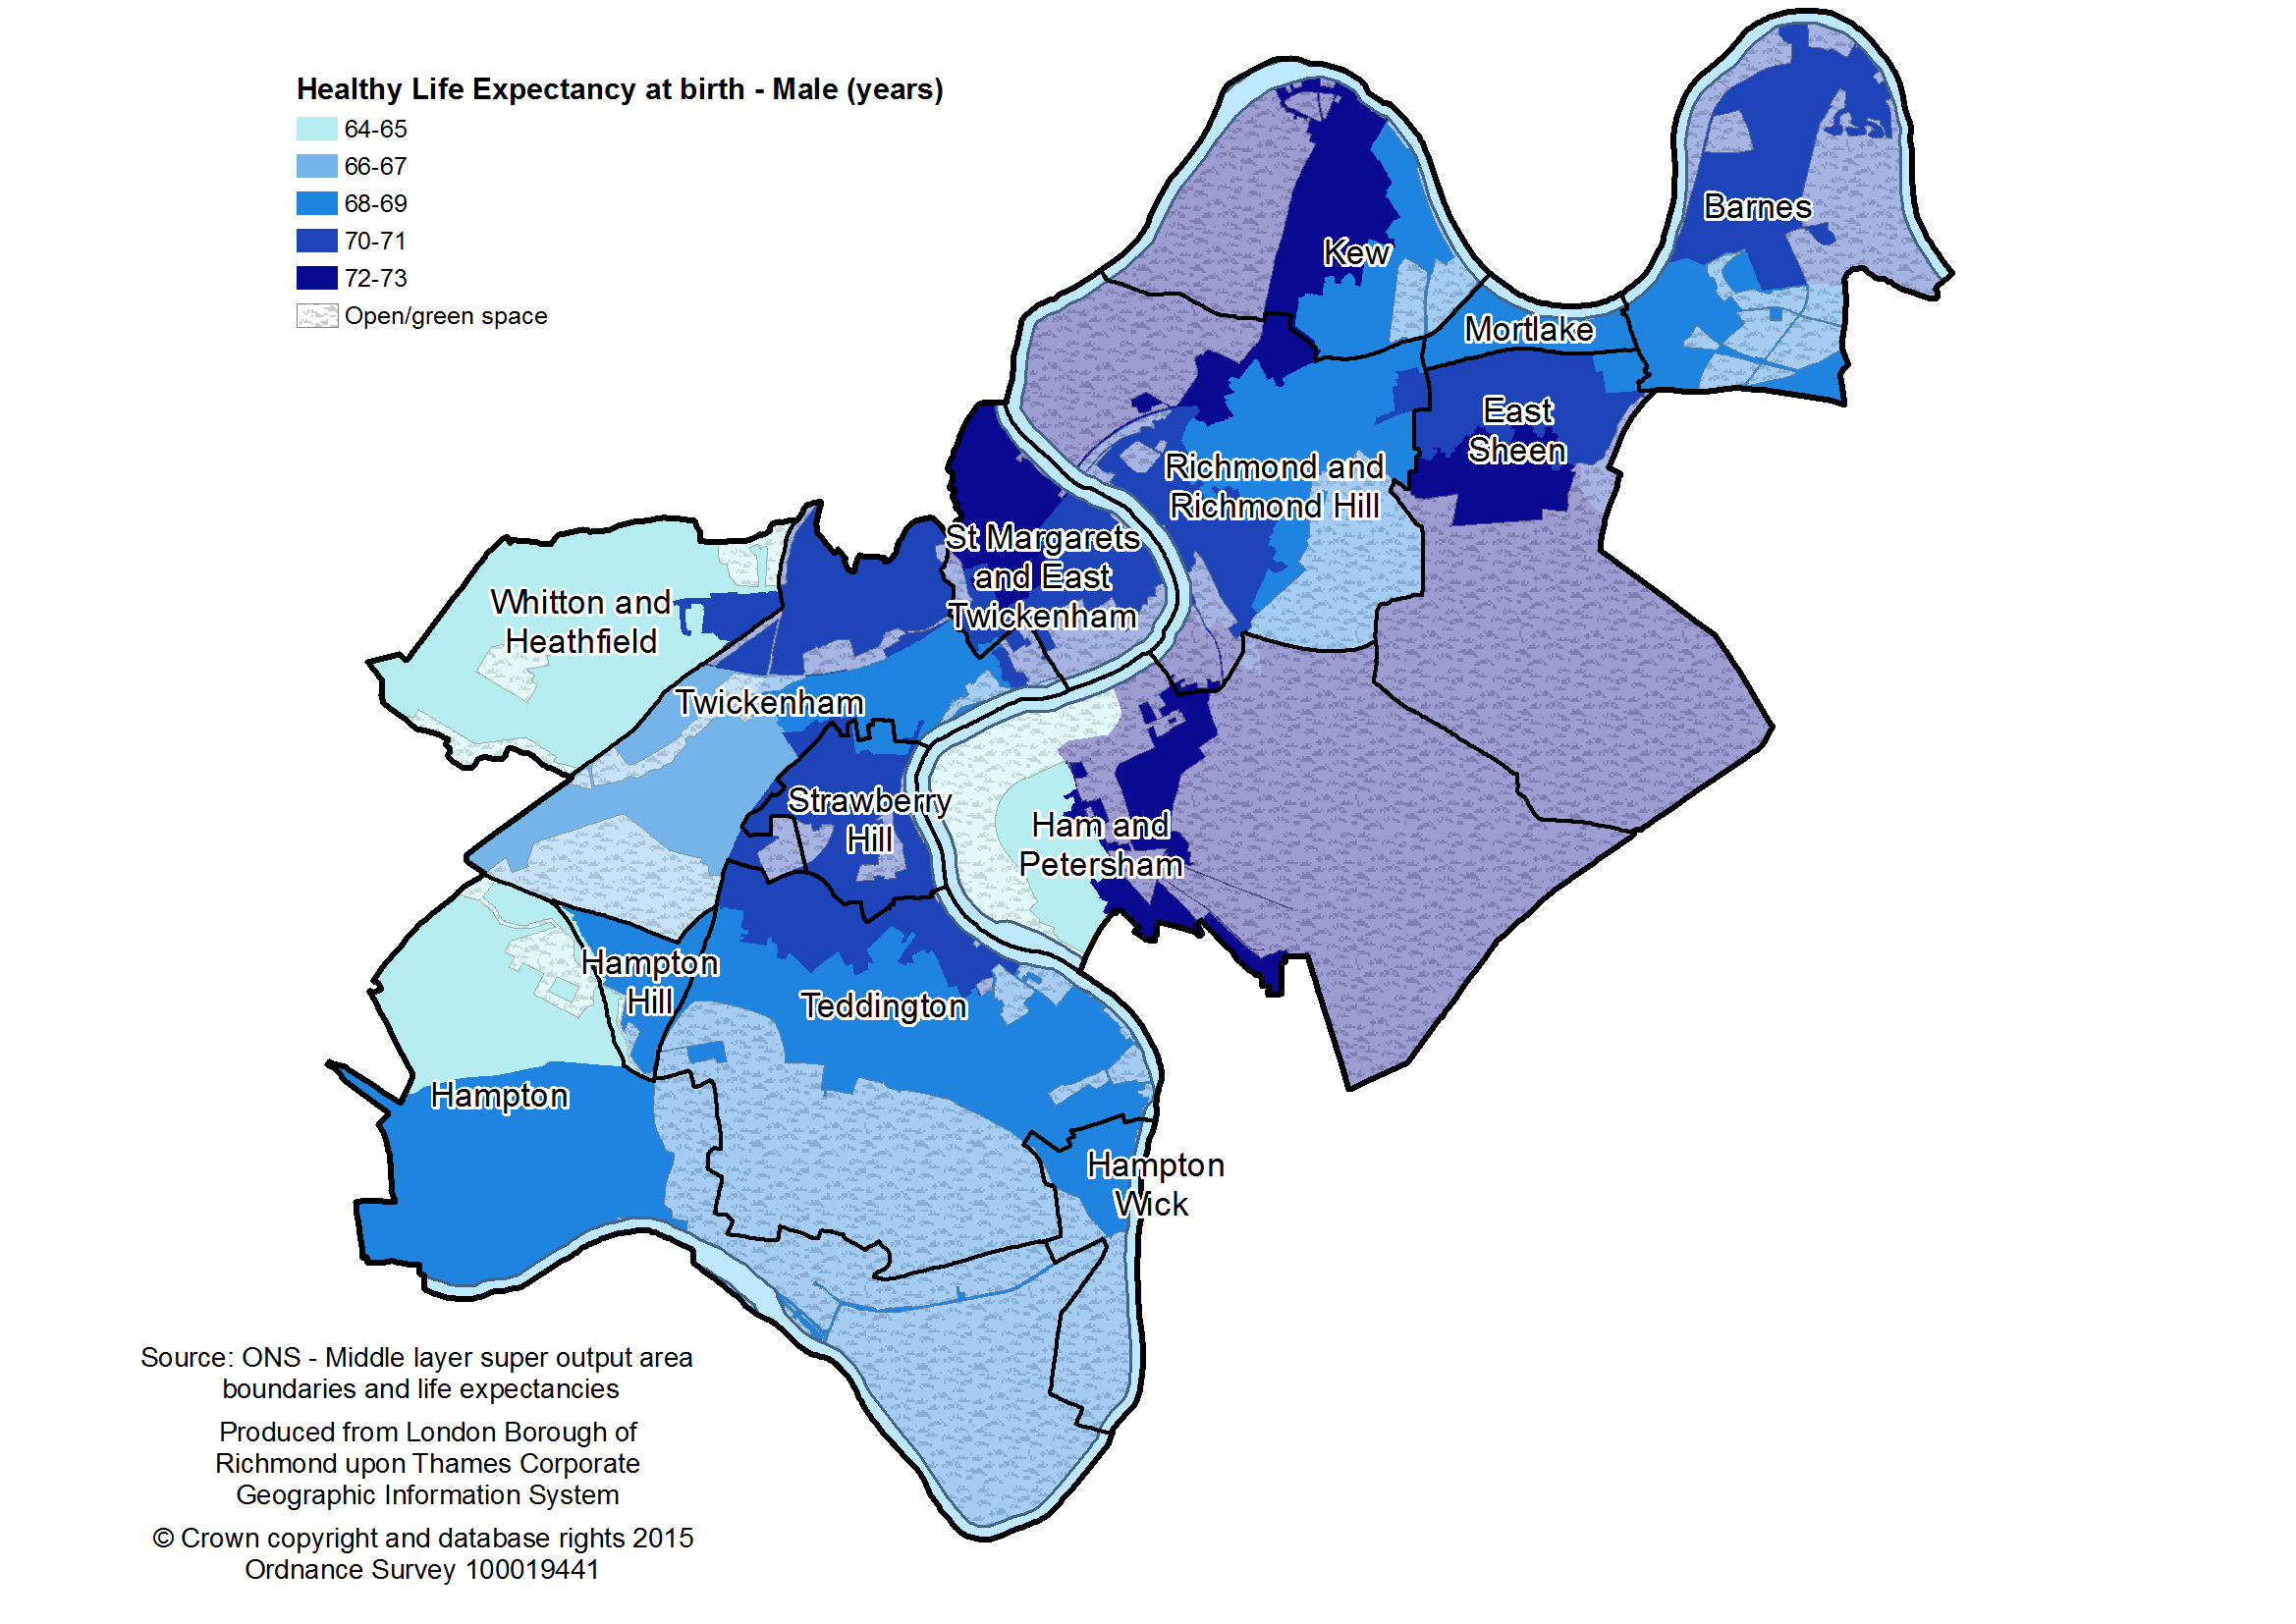
Figure 2: Number of healthy life expectancy at birth for females, 2009 – 2013
[1] The Slope Index of Inequality is a measure of the gap between the most deprived area and the least deprived area, which takes account of inequality across the whole distribution rather than focusing only on the extremes, and gives greater weight to larger populations and less weight to smaller populations.
[2] Healthy life expectancy is the estimated lifetime spent in ‘very good’ or ‘good’ health based on how individuals perceive their health. Disability-free life expectancy is lifetime spent free from a limiting persistent illness or disability based upon a self-rated functional assessment of health.
[3] The Index of Multiple Deprivation 2015 – report on DataRich for more information.
[4] Note that different age ranges have been used in the maps to allow easy comparison between areas within Richmond and within each gender, though this prevents direct comparison between genders.