
The Richmond Story 2017/18
Joint Strategic Needs Assessment and Annual Report of the Director of Public Health
Business Intelligence Team
The Richmond Story 2017/18 PDF Version
Contents
- Infographics
- The Richmond Story
- More Information
- Introduction
- Place
- Start Well
- Live Well
- Age Well
- References
- Appendix: Joint Health and Wellbeing Strategy Scorecard 2017/18
- Document information
Infographics
The Richmond Story
Local authorities and CCGs have equal and joint statutory duties to prepare and publish a joint strategic needs assessment (JSNA) for their area, through the Health and Wellbeing Board. The JSNA is the on-going process to describe the current and future health and wellbeing needs of the local population to inform services. It provides a framework for improving local health and wellbeing and addressing inequalities.
The Richmond Story is an annual snapshot of some of the priority local needs identified through the JSNA process, developed to inform commissioning intentions. These needs are linked to the theme of ‘place’ and the life-course themes of ‘start well’, ‘live well’ and ‘age well’.
More Information
This is only a snapshot of the detailed information available. Please see www.richmond.gov.uk/jsna for further information or contact jsna@richmond.gov.uk for help finding the referenced documents.
The JSNA incorporates a wide variety of quantitative and qualitative data about demography and the pattern of determinants of health, risk factors and diseases, service utilisation, effectiveness, patient and public voice and cost. To make sense of local information, data is compared over time (trends), with other comparable boroughs (benchmarking), where available with standards (expected pattern) and with what local people and health and social care professionals tell us (voice). A better understanding of local issues is gained by bringing together information from different sources.
The JSNA core dataset is updated regularly and is available on DataRich www.datarich.info, along with a range of other data and information relating to the borough and its residents.
Place
Where we live, work and play has a big impact on our health and wellbeing, both through direct health impacts, such as exposure to toxins, and indirectly, such as encouraging positive or negative health behaviours or exposing us to other stresses and pressures.
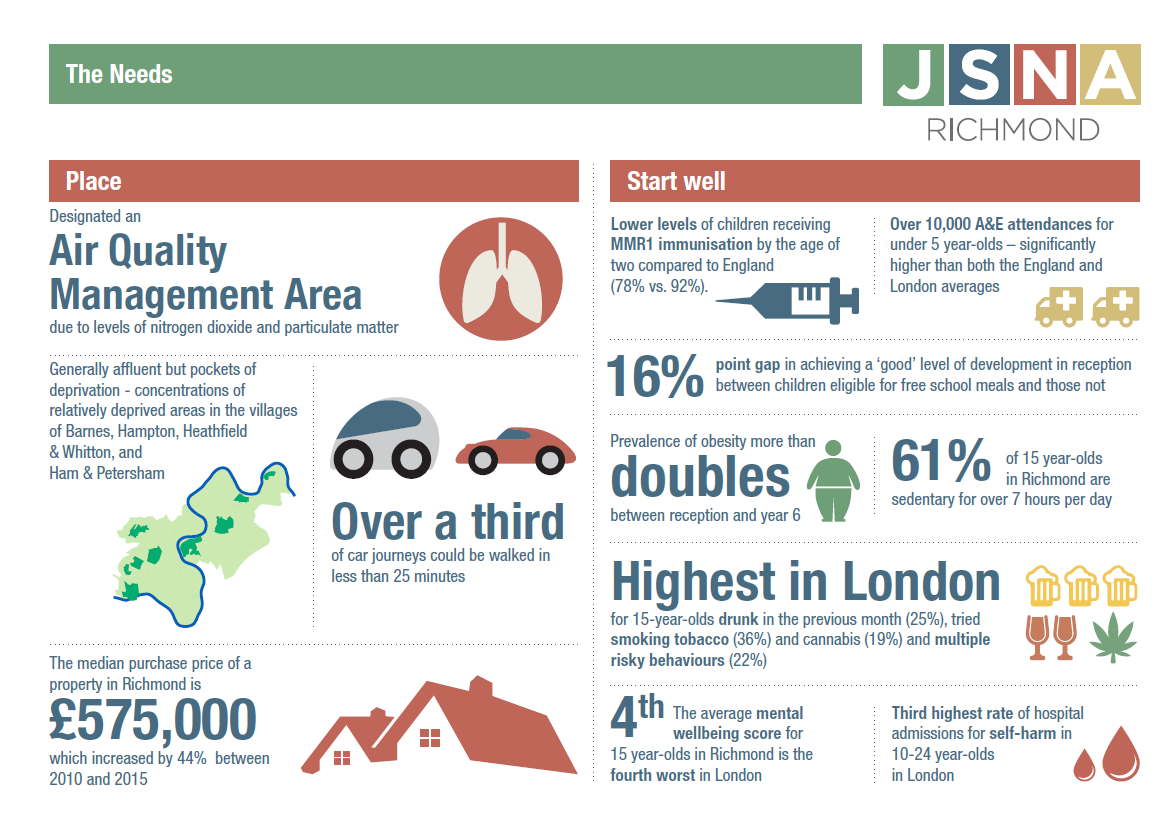
- The borough has been declared an Air Quality Management Area (AQMA) because it has exceeded permissible levels of pollution. The predominant source of air pollution in the borough is road traffic with a smaller contribution coming from boilers, construction and wood burners.[1]
- Three primary schools in Richmond are in areas that exceed the legal air pollution limits.[2]
- The annual mortality burden in London from long term exposure to fine particulate matter (PM5) and nitrogen dioxide (NO2) is estimated to be equivalent of up to 9,400 deaths2 and associated health impacts incurring an economic burden between £1.4 billion and £3.7 billion.[3]
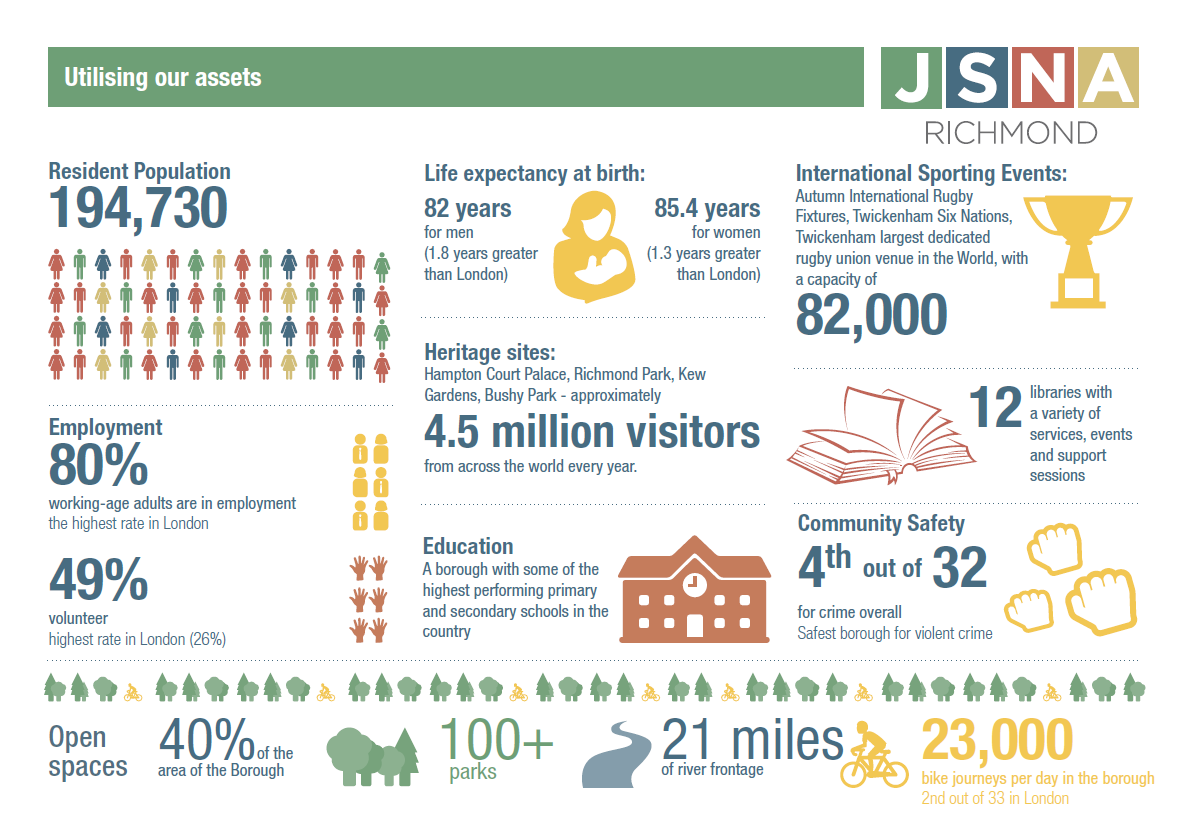
- Active travel is a simple way to add physical activity into the daily routine. The average number of walking trips per person in London has fallen in recent years; 75% of Richmond households own a car (the fifth highest in London) and over a third of journeys could be walked in less than 25 minutes.[4]
- For each child who takes up walking or cycling to school, there can be health benefits, NHS savings, productivity gains and reductions in air pollution and congestion, worth up to £768 and £539 respectively.[5]
- Green space promotes active living and provides important physical, psychological and social health benefits for individuals and the community. Publicly accessible parks (regional, metropolitan, district, local, small and pocket parks) make up 40% of the total area of Richmond.[6]
- Only 28% of residents use outdoor space for exercise or health reasons, although this is the second highest percentage in London.[7] A recent consultation identified lack of seating/resting points and parking as barriers to utilisation of green spaces.[8]
- Whilst overall participation is high, analysis shows that not all population groups engage equally in sport and physical activity. Women, older adults, people with disabilities and mental health difficulties, and those from areas of relative deprivation are some of the groups which demonstrate lower levels of participation.[9]
- Home ownership is associated with increased life satisfaction. 31% of Richmond residents own their home outright; however the median purchase price of a property in Richmond is £575,000 – which increased by 44% between 2010 and 2015 (compared to 39% in London and 14% in England). [10],[11]
- In 2015/16, Richmond foodbank provided 1,783 three day emergency food supplies for people in crisis. Benefit delays and low income are the most common reasons why people are currently being referred. Richmond foodbank is appealing for more donations due to demand for food supplies.[12]
- There are no areas in Richmond ranked in the most deprived decile of local authorities in England i.e. the 10% most deprived areas. However, there are concentrations of relatively deprived areas in the ward of Hampton North, Heathfield and Ham, Petersham & Richmond Riverside.[13]
Start Well
What happens in pregnancy, childhood and adolescence, impacts on physical and emotional health all the way through to adulthood.
- There is gap in educational attainment between children eligible for free school meals and those not. 61% of children eligible for free school meals achieved a ‘good’ level of development at the end of reception and 72% achieved the expected level in the phonics screening check in Key year 1, reading, writing and maths, compared to 77% and 89% for non-eligible children, respectively.[14]
- The complex and hidden nature of Child Sexual Exploitation means that it is very difficult to provide an accurate number of either current or former victims, however the following children may be at particular risk:
- The rate of children who are the subject of a child protection plan has doubled in the past five years, with 115 children recorded as at March 2015
- In 2014-15 approximately 220 children were in households living in temporary accommodation
- Around 80% of looked after children are placed in care outside the borough
- There are around 20 unaccompanied asylum seeking children in Richmond
Patterns of healthy behaviours are often established early in life through education and what is observed at home in the family, and childhood outcomes can function as indicators of later health problems.
- A significantly lower percentage of children (78%) have received 2 doses of MMR immunisation at or before the age of five compared with the England average (88%).[15]
- The rate of A&E attendances (0-4 years) has increased steadily the last three years, from 518 per 1000 in 2013/14 to 732 per 1000 in 2015/16. This is now significantly higher than both the England average (588 per 1000) and the London average (707 per 1000).[16]
- In 2015/16, there were 90 hospital admissions as a result of self-harm in those aged 10-24 year-olds, which equates to the third highest rate in London.[17]
- The average mental wellbeing score for 15 year-olds in Richmond is the fourth worst in London. 20
- In reception year, 5.1% of children are obese, the lowest in England. Nevertheless, by Year 6, prevalence more than doubles to 11%, and is even higher in the more deprived areas of the borough.[18]
Younger adults can be more prone to risk-taking behaviour, with tobacco use and binge drinking generally being associated with this group.
- The cumulative risk from multiple unhealthy behaviours is significant[19]. Over a fifth of 15 year-olds in Richmond have 3 or more risky behaviours, including smoking, drinking, cannabis, other drugs, diet and physical health, which is the highest in London.[20]
- Prevalence of smoking in 15 year-olds, is 14.3%, which is more than twice the London average (6.1%), and 36% of 15 year-olds have tried smoking, the highest rate in England.20
- Nearly one in five (19%) 15 year-olds in Richmond report having tried cannabis, the highest proportion in London, and third highest in the country (London and England averages 11%).20
- 15 year-olds in Richmond drink more regularly than in any other London borough – 9% are regular drinkers and 25% reported being drunk in the previous 4 weeks.17
- 61% of 15 year-olds’ in Richmond report an average daily sedentary time of over 7 hours.[23]
Live Well
Our social environment has an impact on what we do both directly, through our opportunities and the availability of resources, and indirectly, through associated stresses and pressures.
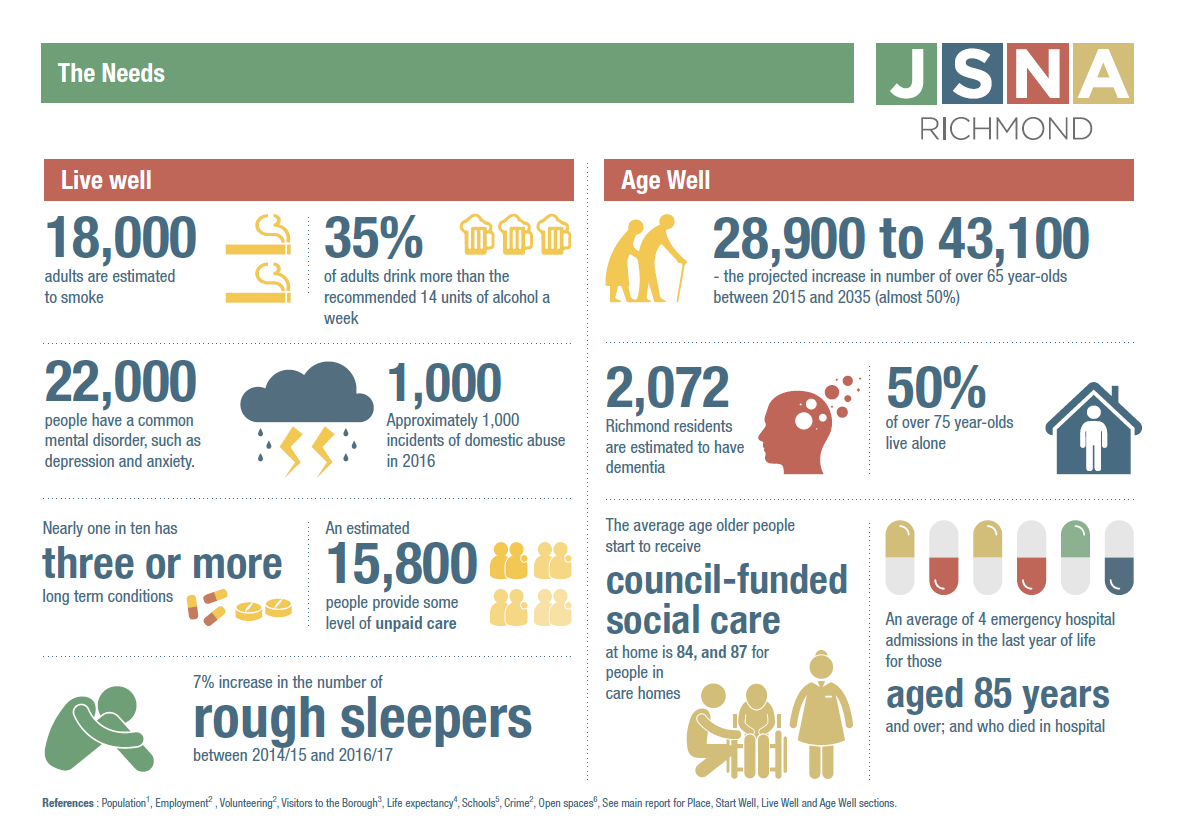
- Approximately 15,800 people provide some level of unpaid care and 15% of those provide more than 50 hours unpaid care per week. This is much higher than the number of carers identified as such by GPs, the voluntary sector and social care.[24],[25]
- Between April-November 2016, there were 718 incidents of domestic abuse. Controlling behaviour is the main type of domestic abuse suffered in Richmond borough. [26]
- Life expectancy is about 5 years lower for men and 3 years lower for women in the most deprived than in the least deprived areas within Richmond (with the biggest contributor being cardio-vascular diseases for men and cancer for women).[27],[28]
- Between 2014/15 and 2016/17 there was a 7% increase in the number of rough sleepers in the Borough, however between 2015/16 and 2016/17 the figure decreased from 133 to 128.[29] Given the comprehensive outreach work that exists in the London Borough of Richmond there is a high degree of confidence in these figures compared to other boroughs reporting lower levels of rough sleeping where there is minimal or no outreach provision.
- Rough sleepers have complex needs: 96% of people living in SPEAR supported accommodation have mental health needs and 30% have a significant physical health issue. In addition, 60% have an issue with alcohol and/or substance misuse.[30]
The causal chain leading to long-term conditions is complex. The impact of a person’s social and environmental surroundings, including employment and housing, and factors such as loneliness and isolation influence the uptake of unhealthy behaviours.
- An estimated 18,000 (12%) adults in Richmond [31]
- 35% of adults in Richmond drink more than the limit of 14 units of alcohol per week recommended in order to keep to a low level of risk of alcohol-related harm, which is the third highest proportion in London.[32]
- More than 50% of over 16 year-olds are overweight or obese, with 19% of people in Richmond having said that they do not take part in any physical activity.[33]
Unhealthy behaviours and exposures go on to account for a high proportion of disease. The subsequent impact of poor health and mental well-being results in huge costs to the individual, the economy, and the health and social care system.
- An estimated 22,000 people in Richmond have a common mental disorder (such as depression and anxiety) and there 6,517 adults identified with depression by GPs.[34],[35] Only 9.2% of working age adults receiving mental health services in Richmond are in paid employment and the employment rate of those with a long-term health condition is 4.2% lower than the overall employment rate.[36],[37]
- People with disabilities are more likely to suffer a range of barriers and are at higher risk of other health problems. 2,802 (2%) people aged 16-74 years consider themselves to be economically inactive due to a permanent sickness or disability.[38],[39]
- Nearly one in three people registered with a GP in Richmond has one or more long-term condition and nearly one in ten has three or more. National prevalence models suggest that large numbers of people with long term conditions are undiagnosed in Richmond (e.g. 2,700 people with undiagnosed coronary heart disease, and 4,850 people with undiagnosed diabetes).[40],[41],[42]
- Multimorbidity is common; over 15% of people with a heart condition in Richmond have at least three other long-term conditions. In addition, 20% of patients have either depression or anxiety.[43]
Age Well
- The population is ageing; the number of people aged 65 years or over is projected to increase by almost 50% in the next 20 years (from 28,900 in 2015 to 43,100 in 2035).[44]
- Of the population aged 85 years and over, only 34% received a council funded service at home and 7% in a care home, meaning that approximately 2,400 (59%) people aged 85 years and over are either not receiving care or are arranging care for themselves.[45]
- The average age older people start to receive council-funded social care at home is 84, and 87 for people in care homes.[46]
There are a number of stresses that affect older people in particular, leaving them vulnerable to mental and physical health problems.
- It is estimated almost half of people aged over 75 years in Richmond live alone (6,621 people).[47]
- An estimated 14% (3,442) of older people in Richmond borough are carers, providing help and support to a partner, child, friend, relative or neighbour due to age, physical or mental illness, addiction or disability.45
The accumulated impact of behaviours and exposures earlier in life, combined with functional decline lead to increased levels of disease in older people.
- It is estimated that 2,072 Richmond residents have dementia. Only 64% of people with dementia have received a formal diagnosis, which is higher than the national average but lower than the London average and below the target of 66%. Co-morbidity is high, with 70% of people with dementia having one or more other long term conditions.45
- Following a downward trend in the percentage of people who die in winter months (excess winter deaths) in Richmond, in 2014/15 this has increased with 137 excess deaths, 90 of which were in those aged 85 years and over – compared to 9 in the previous year.[48]
- 6% of the over 65 year-olds population and 39.2% of at-risk individuals received flu vaccination in the winter of 2015/16, both below the England averages. [49]
- Falls by older people and the injuries resulting from them can lead to disability and a loss of independence. The rate of hospital admissions for injuries due to falls in those aged 65 and over is similar to the national and regional averages. In 2015/16 there were 626 admissions due to falls.[50]
- Delayed transfers of care (DTOC) from hospital are an important measure of the interface between health and social care services. The rates of DTOC (10.6 per 100,000) and, in particular, those which are attributable to social care (4.0 per 100,000) are high compared to similar boroughs (6.5 and 2.2 per 100,000, respectively).[51]Error! Bookmark not defined.
- A big part of care given in the last year of life can be about avoiding hospital admissions. As health deteriorates towards the end of life, people may find they attend hospital multiple times, sometimes inappropriately. This can be disruptive and unsettling, and is not cost effective.[52] Those aged 65 years and over who died in hospital, were admitted to hospital an average of four times in the last year of life (including the terminal admission).The total cost of these admissions was £1,522,390 for those aged 85 year and over; £626,073 for those aged 65-74 years.[53]
References
[1] London Borough of Richmond upon Thames website, Air pollution, www.richmond.gov.uk/air_pollution.
[2] Mayor of London, London Assembly; hundreds of London schools exceed legal air quality levels, July 2016.
[3] Understanding the Health Impacts of Air Pollution in London, Walton H et al (2015)
[4] Car ownership and walking journeys in London: Mayor of London. Health impacts of cars in London. London: Greater London Authority; 2015.
[5] Richmond annual report of the director of public health 2016, Prevention: redressing the balance in a time of austerity
[6] London Datastore: Access to Public Open space and nature by ward, published by GiGL.
[7] Public Health Outcomes Framework 1.16, 2014/15.
[8] Friendly Parks for Young and Old: Barnes Green Consultation; London Borough of Richmond upon Thames and Richmond Dementia Action Alliance (DAA), September 2016.
[9] JSNA Community Access Strategy Newsletter, 2017.
[10] English Housing Survey, Headline report 2013-14, ONS; GLA London Borough profiles.
[11] GLA London DataStore; Average house prices, Borough.
[12] Hunger and Poverty in Richmond, Richmond Food Bank 2016/17
[13] DataRich The Index of Multiple Deprivation 2015 report
[14] Public Health Outcomes Framework 1.02i & 1.02ii, 2015/16.
[15] Public Health Outcomes Framework 3.03x, 2015/16
[16] JSNA newsflash – Child Health Profiles 2017
[17] PHE Child Health Profiles, 2015/16.
[18] PHE Child Health Profiles (overview of child health), 2015/16.
[19] Clustering of unhealthy behaviours over time: implications for policy and practice, Kings Fund 2012.
[20] What About YOUth? Survey 2014/15.
[21] Public Health England Specialist Substance Misuse Interventions Report, Q4 2015/16.
[22] PHE Child Health Profiles, 2013/14-2015/16.
[23] PHE Physical activity profiles 2014/15
[24] Census 2011, KS301EW.
[25] Carers Health Needs Assessment, 2014.
[26] JSNA Strategic Assessment Newsletter, 2017.
[27] Public Health Outcomes Framework 0.2iii, 2012-14.
[28] The Segment Tool 2016 (2012-14 data).
[29] CHAIN data.
[30] SPEAR Impact Report 2016.
[31] Public Health Outcomes Indicator 2.14, 2015.
[32] PHE Local Alcohol Profiles for England, 2011-14.
[33] PHE Physical activity profiles, Excess weight (2013-15), Percentage of adults achieving less than 30 minutes of physical activity per week (2015)
[34] PHE Common Mental Health Disorders Profile – People estimated to have any common mental health disorder, 2014/15 CCG.
[35] PHE Common Mental Health Disorders Profile – Adults with depression known to GPs, 2014/15
[36] Public Health Outcomes Framework 1.08i, 2015/16.
[37] Adult Social Care Outcomes Framework 1F, 2015/16.
[38] Disability Health Needs Assessment, 2014.
[39] Census 2011, DC3302EW.
[40] ERPHO 2011 Modelled estimate of prevalence of CHD in England.
[41] Quality and Outcomes Framework 2015/16 prevalence.
[42] Estimated 2015 prevalence of diabetes adjusted for age, sex, ethnic group and deprivation; APHO Diabetes Prevalence Model for England, 2012.
[43] Cardiology Care Pathway Review, part 1, 2014
[44] GLA population projections, long term interim 2015 round
[45] Richmond Joint Health and Wellbeing strategy 2016-21.
[46] The Self-Funder Population, London Borough of Richmond upon Thames, ACS Performance & Quality Assurance, March 2014 (unpublished)
[47] Projecting Older People Population Information System, 2016.
[48] Public Health Outcomes Framework 4.15i-ii 2014-15.
[49] Public Health Outcomes Framework 3.03x,xiv-xv 2015/16.
[50] PHE Public Health Outcomes Framework, 2.24i, 2015/16.
[51] Annual Public Health Report 2014/15
[52] Richmond CCG End of Life Care Strategy 2017-2020 (in print)
[53] Richmond End of Life Care report, 2015
Appendix: Joint Health & Wellbeing Strategy Scorecard 2017/18
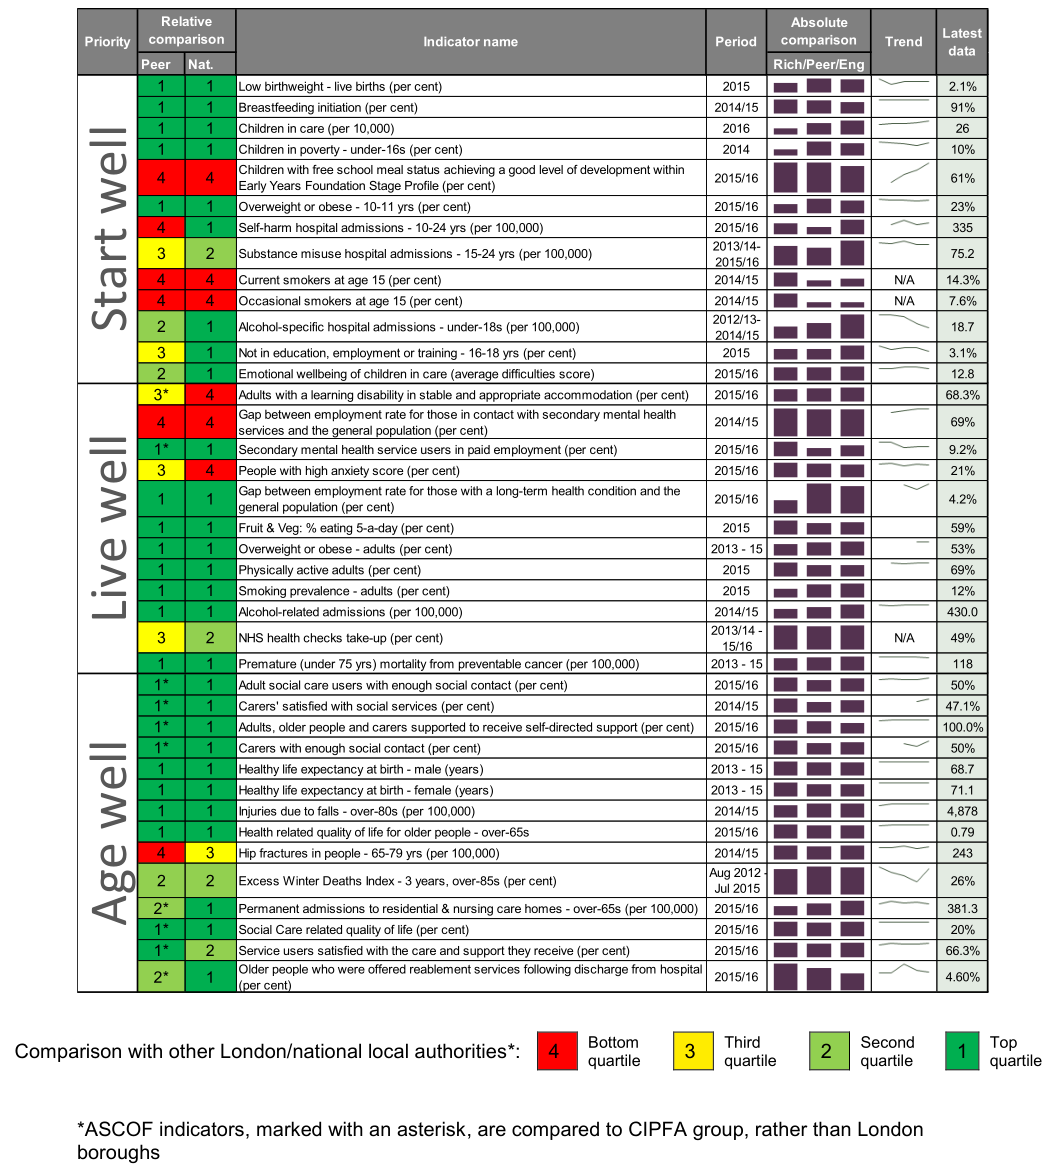
This scorecard of performance measures was produced to aid the review of the progress of the Joint Health and Wellbeing Strategy 2016 – 21 (JHWBS). The scorecard is structured following the three JHWBS themes ‘Start Well, Live Well and Age Well’. Indicators from the NHS Outcomes Framework, the Public Health Outcomes Framework, the Adult Social Care Outcomes Framework (ASCOF) and the Child Health Profiles have been used, since these are national, benchmarked and validated.
RAG-rating
Richmond performance is colour-coded according to the quartile in which it falls, when compared to other London boroughs (or compared to other boroughs in the same CIPFA [Chartered Institute of Public Finance and Accountancy] group, for the six ASCOF indicators).
Since Richmond is relatively healthy and wealthy, it will compare favourably for many outcomes. Therefore caution in interpreting the indicators is needed. For example, although 12% of over-18s smoking appears low when compared to London and England, this still equates to more than 17,000 smoking adults in Richmond, which has an impact on health outcomes for a large number of residents.
Indicator selection
Indicators were initially selected from the outcomes frameworks by considering the following factors to identify 10-11 indicators for each priority area:
- Marker indicators with wider relevance
- Robust indicator definitions
- Historical data available, allowing trends to be seen
- Performance issue or deteriorating performance
- Indicators spread across population range (e.g. children and adults, deprived and affluent)
- Range of indicators including short term and long-term sensitivity
- Broken down by equality characteristics
The data has been refreshed for the 2017/18 scorecard where possible.
Document information
Date published: September 2017
Topic lead: Steven Bow, Business Intelligence Manager