A Framework for Prevention of Suicide and Self-Harm
1 Executive Summary
Local authorities have the lead responsibility locally for suicide prevention and ensuring collaborative working with the police, CCGs, coroners and voluntary bodies.
The overall aim of this needs assessment of suicide and self-harm was to inform a strategic framework to ensure joint working across agencies and sectors on action to prevent suicide and self-harm. It is set within the context of the national strategies- Preventing suicide in England (2012) and No Health without Mental Health (2011).
The needs assessment involved an audit of suicide cases 2006-2013 using ONS mortality data and coroners files. 105 cases met the criteria for inclusion in the audit (covering Richmond residents or deaths occurring in Richmond). The audit of self-harm was based on two-year hospital data for 2012/13 and 2013/14 for Richmond residents admitted to hospital or presenting at A&E.
The analysis identified the factors that influence the risk of suicide and self-harm locally, and those groups with increased risk of self- harming and committing suicide- and therefore the focus for preventative measures.
The development of the framework also takes account of the evidence about what measures are likely to be effective for reducing suicide and self-harm, (including NICE guidance).
The framework also includes comments from initial consultations including discussions at a multi-agency workshop (September 2014) involving those working in mental health, community safety, substance misuse, social care, primary care, and children’s services and also a number of service users and representatives.
The framework identified four priority areas to focus collective efforts on reducing rates of suicide and self-harm that can be taken forward through related plans and strategies for mental health, substance misuse, children’s services and public health.
2 Introduction
The overall aim of this needs assessment of suicide and self-harm was to provide a strategic framework to ensure joint working across agencies and sectors on action to prevent suicide and self-harm.
The aim is to:
- Define the pattern of suicide and self among in Richmond based on a suicide and self-harm audit
- Identify the factors that influence the risk of suicide and self-harm, and those groups with increased risk of self-harming and committing suicide- and therefore the focus for prevention measures.
- Map and appraise the current range of services that have a role in preventing suicide and self-harm, particularly relating to high risk groups.
- Identify priorities –areas currently underdeveloped or where there are gaps- that are likely to have impact in reducing risk and preventing suicide and self-harm.
Suicide and self-harm are not inevitable, and there is substantial evidence-based guidance on how the risks of suicide and self-harm can be reduced as the basis for prevention strategies.
A wide range of mental health problems are associated with self-harm, including borderline personality disorder, depression, bipolar disorder, schizophrenia, and drug and alcohol use disorders.
Services have an important role in helping families, parents, teachers and others deal with both the threat and consequences of self-harm and suicide.
The framework is not intended to stand-alone – but provides a tool to ensure that actions to prevent suicide and self-harm, particularly among high risk groups, are fully integrated within other local strategies and services relating to mental health, substance misuse, welfare support, young people and community safety. Performance management of the implementation of these strategies need to encompass actions that help prevent self-harm and suicide. Specific strategies are:
- Joint Mental Health Strategy Implementation Plan 2014-16
- Joint Strategy for Prevention of Substance Misuse 2013-16
- Joint Children & Young People’s Health Strategy and Commissioning Plan 2014-17
- Children & Young People’s Emotional Wellbeing & Mental Health Strategy 2013-16
- Richmond Out of Hospital Strategy 2014-17
The framework is set within the context of the national strategies- Preventing suicide in England (2012) and No Health without Mental Health (2011). Local authorities have the lead responsibility locally for suicide prevention and ensuring collaborative working with the police, CCGs, coroners and voluntary bodies.
3 Background
3.1. Terminology
Self-harm is:
“Any act of self-poisoning or self-injury carried out by a person, irrespective of their motivation.” [1]
For the purpose of this work, and in keeping with the definition used by NICE, the term is applied to those aged eight years and older.
Suicide is:
“The act of deliberately killing oneself” [2]
The Office of National Statistics applies the term suicide only to those aged 15 years and older. Whilst this age cut-off is to an extent arbitrary and highly debatable when applied to individual cases, it has been employed in this work in line with the definition used nationally.
3.2. Recording self-harm and suicide
Self-harm
Only a fraction of self-harm incidents will result in a hospital presentation, with hospital contact being more likely in the case of overdose and less likely for cutting.[3] Although A&E attendances and hospital admissions are therefore only the tip of the iceberg, these are the only routine data sources available for quantifying the incidence of self-harm.
Each A&E attendance is classified as relating to a “patient group”, one of which is “deliberate self-harm”. For each hospital admission, a collection of diagnoses are recorded, and a range of diagnostic codes relating to self-harm are available.
Suicide
In the UK, there are defined criteria for reporting a death to a coroner, which include when:
- The cause of death is unknown
- The death was violent or unnatural
- The death was sudden and unexplained
- The deceased was not visited by a medical practitioner during their final illness
- The deceased was not seen by the doctor who signed the medical certificate within 14 days before death or after they died [4]
Once a death has been reported to a coroner an inquest may occurs, the purpose of which is to establish a verdict on how the death occurred. The verdict is retrospective and to give a verdict of ‘suicide or act of self-harm’ there must be evidence beyond reasonable doubt that the deceased intended to end their own life. This verdict cannot be returned when there is insufficient evidence to establish intention. [5]
Other coroner’s verdicts which may have been the result of suicide, but with insufficient evidence to establish a verdict of ‘suicide or act of self-harm’ include:
- Dependence on drugs
- Misuse of drugs
- Deaths by accident or misadventure
- Open verdict
- Other narrative verdict
The National Statistics definition of suicide includes deaths given an underlying cause of intentional self-harm and deaths through self-injury/poisoning of undetermined intent. Deaths coded as being ‘of undetermined intent’ are cases which lack sufficient evidence to demonstrate intention to end life. These are classified by the Office of National Statistics as suicide under the assumption that the majority of deaths in adults will have been deliberate. This is also the reason for exclusion of deaths in those under 15 years of age, where accidental death, neglect or abuse may be more likely. [6]
In the UK, the Office of National Statistics codes deaths using the International Classification of Diseases, Tenth Revision (ICD-10 World Health Organisation, 2010). These codes are shown in Table 3.1.
Table 3.1. ICD-10 codes used to define suicide in the UK
| ICD-10 code | Description |
| X60–X84
|
Intentional self-harm |
| Y10–Y341 | Injury/poisoning of undetermined intent |
| Y87.0 / Y87.22 | Sequelae of intentional self-harm / injury /
poisoning of undetermined intent |
There is a recognised lag between the occurrence of a suicide and the recording of suicide by the Office of National Statistics. This lag is due to the time that an inquest lasts, which can be months or years. The death is only listed on the death register once a verdict has been returned.
3.3. Risk factors for self-harm[7]
Individual risk factors for self-harm include:
- Being female
- Adolescence and young adulthood (peak age 18 years for women; 23 years for men)
- Having a history of mental ill-health
- More than two-thirds of those attending emergency departments following an act of self-harm meet criteria for a diagnosis of depression
- One-half of those attending emergency departments with self-harm meet criteria for personality disorder (PD), though this label is disputed by some as stigmatizing and offensive and there is circularity in its definition (self-harm is a defining feature of borderline and histrionic PD)
- Of all patients diagnosed with a mental illness, those with phobic and psychotic disorders are at highest risk for self-harm. Those diagnosed with schizophrenia have the highest rates: about a half of this group will have harmed themselves at some point
- There are higher rates of particular psychological characteristics among those who have a history of self-harm including impulsivity, poor problem solving and hopelessness
- Those with a history of alcoholism and drug use
- About one-quarter of those who self-harm will have a diagnosis of harmful use of alcohol
Self-harm occurs in all sectors of society but it is more prevalent among those who are:
- Disadvantaged in socio-economic terms
- Single or divorced, especially single parents
- Live alone
- With a severe lack of support
There is a strong link between the number and type of adverse life events and self-harm. Those who have experienced victimisation, particularly sexual abuse, are more likely to self-harm. Some life events, particularly relationship problems, can precipitate an act of self-harm. Many people with a physical illness who self-harm report this as the precipitating factor. There are indications that transgender people have higher rates mental health problems and self-harm but further information is required about this group.
3.4. Risk factors and protective factors for suicide
The World Health Organisation has compiled a list of risk factors and protective factors in ‘Public health action for the prevention of suicide: a framework’ (see Table 3.2 and Table 3.3). [8]
Table 3.2. Risk factors for suicide
| Individual | Sociocultural | Situational |
| Previous suicide attempt | Stigma associated with help-seeking behaviour | Job and financial loss |
| Mental disorder | Barriers to accessing care, especially for mental health and substance misuse | Relational or social losses |
| Alcohol or drug abuse | Certain cultural/religious beliefs concerning suicide | Easy access to lethal means |
| Hopelessness/isolation/lack of social support | Exposure to suicide through media and others | Local clusters |
| Aggressive tendencies and impulsivity | Stressful life events | |
| History of trauma or abuse | ||
| Major physical/chronic illness including chronic pain | ||
| Family history of suicide |
In terms of the demographics of those who have committed suicide in the UK, men have higher rates (the ratio of suicides in men to women is about 3:1) and the peak age for suicide is 40-44 years in men and 50-54 years in women. Those with mental and physical disability have increased rates of suicide, including psychiatric in-patients, those with long-term conditions and those with a recent diagnosis of cancer, coronary heart disease and airways disease. The available data on ethnicity, sexuality and gender reassignment is limited. However, particular black and minority ethnic groups have higher rates of mental ill-health, which is correlated with higher rates of suicide and self-harm. Lesbian, gay and bisexual people are twice as likely as those who define themselves as heterosexual to attempt suicide and lesbian, gay and bisexual people have higher rates of depression, anxiety and alcohol and substance misuse.
Table 3.3. Protective factors for suicide
| Strong connections to family and community support |
| Skills in problem solving, conflict resolution and non-violent handling of disputes |
| Personal, social, cultural and religious beliefs that discourage suicide |
| Restricted access to means of suicide |
| Seeking help and easy access to quality care for mental and physical illnesses |
4 Local Picture- Pattern of self-harm and suicide
4.1. Method for auditing self-harm in Richmond upon Thames
The South East Commissioning Support Unit provided access to datasets of hospital admissions and accident and emergency department (A&E) attendances for Richmond residents for the fiscal years 2012/13 and 2013/14. These data were combined to increase the number of data points available for analysis. Patients resident in Richmond receiving treatment at any NHS hospital in England were included in the dataset. Conversely, residents of other boroughs who were registered to a Richmond GP were excluded from the analysis.
As already discussed, hospital presentations equate to only a fraction of incidents of self-harm in Richmond. Less severe cases are unlikely to attend hospital at all, and only the most severe cases are likely to be admitted. Furthermore, the data suggest that not all self-harm-related A&E attendances are correctly coded as such (see conclusion of section 4.3). Therefore, the figures in this analysis should be considered indicative of underlying prevalence of self-harm, rather than authoritative and complete.
Hospital admissions
All emergency admissions (admission method codes 21-28) in Richmond residents were included. For each hospital admission, the primary diagnosis and up to 24 additional diagnoses (secondary, tertiary etc.) are recorded using ICD-10 (International Statistical Classification of Diseases and Related Health Problems 10th Revision) codes. There are 26 ICD-10 codes related to self-harm (as used by the Health and Social Care Information Centre[9]). However, no emergency admissions include these codes in the primary diagnosis, since this categorises the immediate medical issue dealt with by healthcare. Rather, since self-harm is, or is part of, the cause of the immediate medical issue, it is only ever coded in the later diagnostic fields. A pilot study suggested that looking at the first 15 diagnostic fields would capture all self-harm diagnoses, so only these were included in the analysis. Where an admission had more than one self-harm code in the list of diagnoses, the self-harm code nearest to the primary diagnosis was used to categorise the admission.
It is important to note that a patient may be admitted more than once, so the number of admissions with a self-harm diagnosis is not the same as the number of people who have been admitted with a self-harm diagnosis.
Accident and emergency department attendances
Each A&E attendance is categorised into a “patient group”, one of which is “deliberate self-harm”. This code was used to identify those attendances explicitly recorded as self-harm related.
Again, it is important to note that a patient may attend A&E more than once, so the number of A&E attendances for deliberate self-harm is not the same as the number of people who have attended A&E for deliberate self-harm.
4.2. Method for auditing suicides in Richmond upon Thames
Robust and quality assured mortality data files are routinely available from ONS, which contain the information recorded in death certificates. These data provide reliable numbers of suicides which can be compared nationally. However, the information recorded on a death certificate is limited to basic demographic details and cause and location of death, with little information on other risk factors for suicide.
More detailed information can only be obtained from the coroner’s case files that are produced in the course of an inquest, which would occur for any suspected suicide.
The overlap between these two datasets is considerable, but not complete, due to differences in the timeframes and processing of suicides through each system.
Data from the Office of National Statistics
The Primary Care Mortality Database (PCMD), maintained by HSCIC on behalf of ONS, records information from death certificates, supplemented with coroner’s verdicts, when available. This information is made available locally in the form of a data extract, and goes back as far as 2006. This was used as the data source for Richmond suicides.
The local PCMD extract does not include data beyond Richmond boundaries, but ONS publishes national cause of death data and these were used for comparison. Any differences in data processing by these two sources (local and national) could introduce discrepancies, however these are unlikely to be significant, and care has been taken to apply the same method to both sets of data.
For the trend comparison, these sources were supplemented by the Public Health Outcomes Framework indicator on suicides. For the comparison of suicide method, local data were pooled 2006-2013 to increase the dataset size, but compared to 2013 England data for the most up-to-date national picture.
The suicides are defined in accordance with ONS convention, including deaths of undetermined intent (see section 3.2). Several coding changes were introduced in 2011 that could have affected suicide statistics.[10]
All deaths data in this section are categorised by the date of registration of death. This contrasts with the audit of the coroner’s files, where cases were categorised by date of inquest. Due to the delay between death registration and inquest closure, as well as differences in geographical allocation, these methods produce two different cohorts, although there is, of course, a lot of overlap between them. Therefore the suicides analysed in chapter 4.4 are, necessarily, not identical with those analysed in chapter 4.5.
Inquest files from the West London Coroner’s Court
Once a coroner has reached a verdict concerning a death in the UK, the death is then listed on the death register. Information on deaths is reported to the Office of National Statistics (ONS), which assigns ICD codes each death according to cause. The relevant ICD codes for suicide are listed in Table 3.1.
Relevant deaths for Richmond upon Thames were identified from the ONS registers of deaths to create a list of relevant deaths of Richmond residents and deaths where the place of death was listed as Richmond upon Thames.
The West London Coroner’s Court keeps a register of all verdicts for the time period which was the focus of this audit (2006-2013). This register listed the year of registration of death, name, gender, age, verdict and coroner file number of every case which has passed through the West London Coroner’s Court. For deaths prior to 2013 the team had access to names of the deceased, which meant that the local ONS dataset could be used to identify which cases on the coroner’s register were local. For deaths occurring in 2013 it was necessary to cross-reference by age, gender and year of registration of death. On occasion this generated two or three candidate file numbers and it was then necessary to check each file during the audit to identify the Richmond case.
Verdicts returned from the West London Coroner’s Court were identified from the initial list, as this was the focus of our audit. For logistical reasons, no other coroner’s offices were included in this part of the audit, although a small proportion of Richmond suicides will have ended up in courts elsewhere, due to the location of death. 131 cases were identified between 2006 and 2013. Discussion with the coroner helped to identify which verdicts might be relevant to an audit of suicides. These included: suicide and act of self-harm; open verdict; narrative verdict; deaths by accident and misadventure; dependence on drugs and misuse of drugs.
All deaths for people under the age of 15 were excluded on the basis of the national definition. Deaths where natural or occupational causes were explicitly mentioned in the coroner’s verdict were also excluded. Coding of ONS data was variable and during the audit further cases were identified which had died of natural causes or causes where suicide could be excluded. These included:
- Deaths from hypothermia
- Deaths from mesothelioma and no known occupational exposure to asbestos (coded as open verdicts)
- Deaths in car accidents where the case was a passenger
- A death due to murder
With these exclusions, 107 cases were identified.
The address listed as the residence of the deceased and the place of death were checked using postcode checkers. Two further cases were excluded due to the place of residence and place of death both being outside of Richmond upon Thames, giving a total cohort of 105 cases as the subject of this audit.
The categories for data collection were identified using previous audits and information available on risk factors and precipitants for suicide.
4.3. Findings from analysis of hospital data for self-harm for Richmond upon Thames
National indicators
Hospital stays for self-harm is one of the indicators in the PHE Health Profiles[11]. In 2012/13, the age-standardised rate of hospital admissions for self-harm in Richmond (120 per 100,000 population) was tenth highest in London and significantly higher than the London average (103 per 100,000 population). However, it was significantly lower than the England-wide rate (188 per 100,000 population). This figure represents 216 hospital stays, which is similar to the number of self-harm related admissions obtained using local analysis for the same period.
The PHE Children and Young People’s Health Benchmarking Tool[12] provides similar indicators for the 10-24 age range. In 2012/13, the age-standardised rate of hospital admissions for self-harm in 10-24 year olds was 275 per 100,000, which was the fourth highest in London, and significantly higher than the London average although significantly lower than the England average (201 and 346 per 100,000, respectively). Pooling admissions over the three years from 2010/11 to 2012/13 for the same age range, the Richmond rate was fifth highest in London (272 per 100,000). Again, this was significantly higher than the London average yet significantly lower than the England average (205 and 352 per 100,000 respectively).
However, when comparing between areas, it is important to be aware that observed rates of self-harm may be influenced by variation in admission practice, referrals and recording between hospitals, as well as by the underlying local incidence of self-harm.
Local data
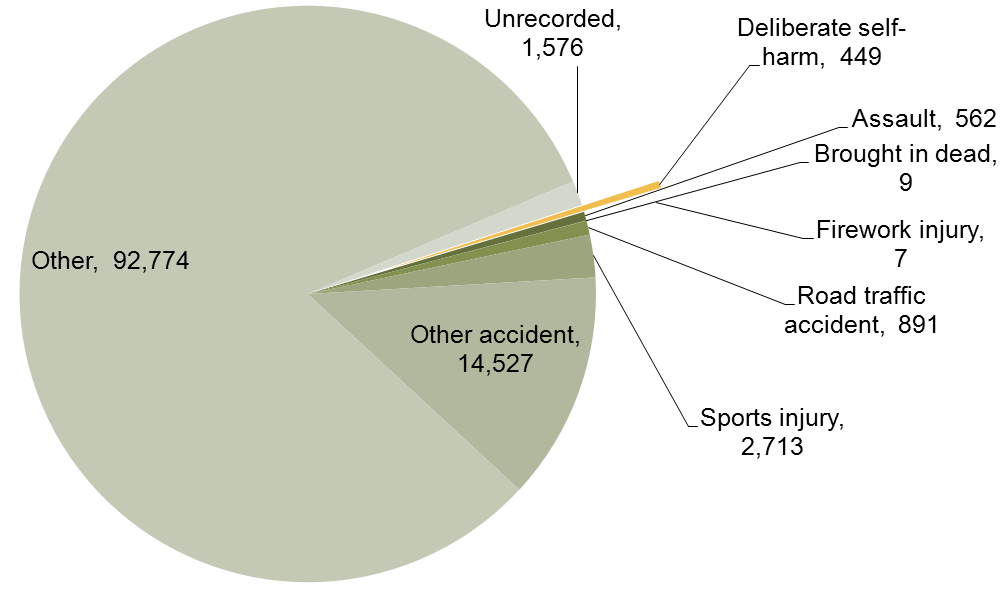
In 2012/13-2013/14, 449 A&E attendances were recorded as deliberate self-harm, which constitutes 0.4% of all attendances by Richmond residents (Figure 4.1).
Figure 4.1. Number of A&E attendances in 2012/13 – 2013/14 recorded as deliberate self-harm
In 2012/13-2013/14, 424 hospital admissions included an ICD-10 code for self-harm within the first 15 diagnostic codes. This constitutes 1.1% of the total number of admissions in Richmond residents (Figure 4.2).
Figure 4.2. Number of hospital admissions in 2012/13 – 2013/14 recorded as self-harm

Of these, the majority of admissions (98.6%, 418 out of 424) were from accident and emergency (or dental casualty) departments, with other admission methods (bed bureau, non-emergency transfer or other unspecified means) accounting for five or fewer admissions each.
Seasonal pattern
Figure 4.3 and Figure 4.4 indicate the numbers of A&E attendances and hospital admissions recorded as being related to self-harm per month over 2012/13 and 2013/14. Both the number of A&E attendances and hospital admissions hover around 20 per month. Although there are peaks and troughs, there is no clear seasonal pattern. There is a suggestion of an increase in self-harm related A&E attendances in the winter months, however this could simply reflect fluctuation due to small numbers.
Figure 4.3. Monthly pattern of self-harm A&E attendances (2012/13 – 2013/14)

Figure 4.4. Monthly pattern of self-harm hospital admissions (2012/13 – 2013/14)

Age and sex
It is instructive to look at the absolute numbers of self-harm related A&E attendances and hospital admissions by age and sex, as this gives an indication of the burden on healthcare services related to each group. However, calculating age and sex-specific rates gives a more accurate idea of the likelihood of self-harm A&E attendances or admissions in each group. Therefore, both approaches have been used.
Figure 4.5 indicates the number of self-harm attendances at A&E by age and sex, indicating similar peaks in females aged 15-19 and 20-24 (54 and 60 attendances respectively) and a later peak in 50-54 year-old females (44 attendances). The number of attendances in males increases more slowly from the 10-14 age range, peaking around the 25-29 and 35-39 age ranges.
Figure 4.5. Age and sex distribution of A&E attendances for deliberate self-harm (2012/13 – 2013/14): count of attendances
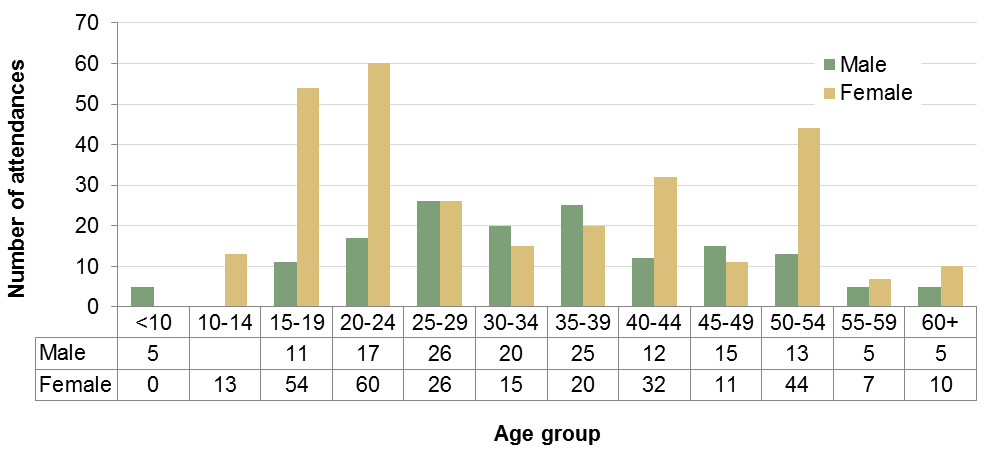
Data for males aged 10-14 suppressed to prevent deductive disclosure as values are smaller than five.
Figure 4.6 indicates the number of self-harm hospital admissions by age and sex. The greatest numbers of admissions were recorded for females in the 15-19 and 20-24 age groups (59 and 47 admissions respectively).
The age group with the highest number of admissions for males was 20-24 although older age groups account for a substantial proportion of self-harm admissions for males.
Figure 4.6. Age and sex distribution of self-harm hospital admissions (2012/13 – 2013/14): count of admissions

Data for males aged 10-14 and 60-64 suppressed to prevent deductive disclosure as values are smaller than five.
Overall, 60% of all self-harm A&E attendances and 53% of all self-harm admissions were in the 25-59 age range.
When these numbers are adjusted for the demographics of the Richmond population (using Office for National Statistics 2013 mid-year population estimate[13]), the higher admission and attendance rates in 15-24 year old females are accentuated. These rates correspond to the relative likelihood of admission for these groups.
Self-harm A&E attendance rates peak in females in 15-19 and 20-24 year olds at 615 and 679 per 100,000 per year respectively, with a second smaller peak in 50-54 year olds (Figure 4.7). The rates in males remain at lower levels, although are similar to or higher than the rates in females in 25-49 year olds.
For self-harm admissions, rates peak in females at 672 per 100,000 per year in 15-19 year olds and, in males, at 352 per 100,000 per year in 20-24 year olds (Figure 4.8). In males there is a small later peak in 50-54 year olds.
Figure 4.7. Age and sex distribution of A&E attendances for deliberate self-harm (2012/13 – 2013/14): age-specific rates per 100,000, five-year age bands

Figure 4.8. Age and sex distribution of self-harm hospital admissions (2012/13 – 2013/14): age-specific rates per 100,000, five-year age-bands

Figure 4.9 and Figure 4.10 focus on the 12-27 age range. It can be seen that whilst, for females, high rates of self-harm attendance and admission are sustained throughout the ages of 15-25, for males, the peak at a similar level is more focused around 22-23 years of age for admissions. Whilst it is tempting to speculate about the causes of the marked variation in A&E attendance rates in teenage girls and young women (with perceptible peaks at age 14-15, 18-19 and 22-23), the undulation within this age range may simply be an artefact of the small number of data points at this level of analysis.
Figure 4.9. Age and sex distribution of A&E attendances for deliberate self-harm (2012/13 – 2013/14): age-specific rates per 100,000, two-year age bands for ages 12-27

Figure 4.10. Age and sex distribution of self-harm hospital admissions (2012/13 – 2013/14): age-specific rates per 100,000, two-year age-bands for ages 12-27

Ethnicity
Comparing the ethnic distribution of self-harm related A&E attendances and hospital admissions with the overall Richmond population, indicates that a disproportionate number of self-harm related attendances and admissions are in the White British ethnic group (Figure 4.11). However, this comparison excludes those whose ethnicity was not stated or not recorded, which amounts to 19% and 7% of self-harm attendances and admissions respectively. If people of White British ethnicity are more likely to have their ethnicity recorded, this could partially or entirely account for this observed difference. Improving the recording of ethnicity would allow inferences to be drawn from these data with greater confidence. Furthermore, these figures are not adjusted for age and sex. See Table 4.1 for a detailed breakdown of numbers of attendances and admissions by ethnicity.
Figure 4.11. Ethnicity distribution of self-harm A&E attendances and hospital admissions compared to Richmond population (2012/13 – 2013/14)

Table 4.1. Ethnicity distribution of self-harm A&E attendances and hospital admissions (2012/13 – 2013/14)
Data suppressed for cells with value smaller than five to prevent deductive disclosure.
| Ethnic category | A&E attendances | Hospital admissions |
| White British | 299 | 316 |
| White Irish | 7 | 9 |
| Any other White background | 28 | 24 |
| White and Black Caribbean | 0 | <5 |
| White and Asian | 0 | 0 |
| White and Black African | 0 | 0 |
| Any other mixed background | <5 | <5 |
| Indian | <5 | 5 |
| Pakistani | 0 | <5 |
| Bangladeshi | 0 | 0 |
| Chinese | 0 | 0 |
| Any other Asian background | 6 | 7 |
| African | <5 | <5 |
| Caribbean | <5 | <5 |
| Any other Black background | 0 | <5 |
| Any other ethnic group | 12 | 17 |
| Not stated | 14 | 28 |
| Not recorded | 73 | <5 |
Means of self-harm
Table 4.2 provides a breakdown of the self-harm related hospital admissions by primary self-harm diagnosis. Ninety-two per cent of self-harm admissions were recorded as intentional self-poisoning, and 1% of these were linked to alcohol. Six per cent were recorded as intentional self-harm by sharp object and the remaining 2% were linked to a range of other means.
Table 4.2. Count of self-harm hospital admissions by first self-harm diagnosis (ICD-10 code, 2012/13 – 2013/14)
Data suppressed for cells with value smaller than five to prevent deductive disclosure.
| ICD-10 | Type | Admissions | |
| X60 | Self-poisoning | Nonopioid analgesics, antipyretics and antirheumatics (e.g. aspirin, paracetamol) | 164 |
| X61 | Antiepileptic, sedative-hypnotic, antiparkinsonism and psychotropic drugs, not elsewhere classified (e.g. antidepressants, tranquillizers) | 130 | |
| X62 | Narcotics and psychodysleptics [hallucinogens], not elsewhere classified (e.g. cocaine, morphine) | 36 | |
| X63 | Other drugs acting on the autonomic nervous system | 5 | |
| X64 | Other and unspecified drugs, medicaments and biological substances | 41 | |
| X65 | Alcohol | 5 | |
| X67 | Other gases and vapours | <5 | |
| X69 | Other and unspecified chemicals and noxious substances | 6 | |
| X70 | Hanging, strangulation and suffocation | <5 | |
| X71 | Drowning and submersion | <5 | |
| X78 | Sharp object | 27 | |
| X80 | Jumping from a high place | <5 | |
| X81 | Jumping or lying before moving object | <5 | |
| X83 | Other specified means | <5 | |
| X84 | Unspecified means | <5 | |
The relative contribution of each method to self-harm hospital admissions is shown for males in Figure 4.12 and females in Figure 4.13. Although the numbers are small, it appears that the relative contribution of self-harm by sharp object was higher in females, and increased with age for males.
Figure 4.12 Proportion of self-harm hospital admissions by age group and method for males (2012/13 – 2013/14)
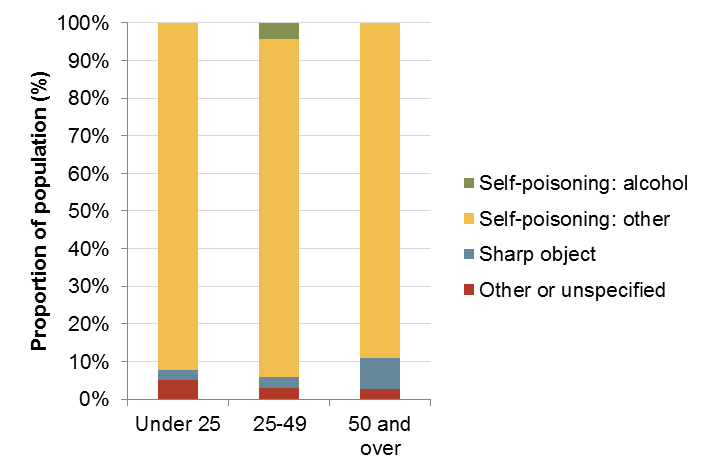
Figure 4.13 Proportion of self-harm hospital admissions by age group and method for females (2012/13 – 2013/14)

As discussed above, the majority of self-harm admissions were due to self-poisoning. Table 4.3 gives a break-down of the admissions due to self-poisoning by substance (as identified in the first self-harm diagnosis ICD-10 code) by age group. Nonopioid analgesics, antipyretics and antirheumatics (X60) were the largest single group of substances involved in self-poisoning admissions in those aged under 25 and those aged 50 and over (55% and 40%, respectively). On the other hand, antiepileptic, sedative-hypnotic, antiparkinsonism and psychotropic drugs, not elsewhere classified (X61) were the largest single group of substances involved in self-poisoning admissions in the 25-49 age group. This overall pattern was similar for both males and females, although the proportion of self-poisoning admissions linked to narcotics and psychodysleptics [hallucinogens], not elsewhere classified (X62) was notably higher in male under-25s (28%).
Table 4.3. Proportion of self-poisoning hospital admissions by first self-harm diagnosis by age group (ICD-10 code, 2012/13 – 2013/14)
| ICD-10 | Substance | Age group | ||
| Under 25 | 25-49 | 50 and over | ||
| X60 | Nonopioid analgesics, antipyretics and antirheumatics | 55% | 31% | 40% |
| X61 | Antiepileptic, sedative-hypnotic, antiparkinsonism and psychotropic drugs, not elsewhere classified | 22% | 46% | 32% |
| X62 | Narcotics and psychodysleptics [hallucinogens], not elsewhere classified | 9% | 9% | 10% |
| X63 | Other drugs acting on the autonomic nervous system | 1% | 1% | 3% |
| X64 | Other and unspecified drugs, medicaments and biological substances | 12% | 8% | 12% |
| X65 | Alcohol | 0% | 2% | 2% |
| X67 | Other gases and vapours | 0% | 1% | 0% |
| X69 | Other and unspecified chemicals and noxious substances | 1% | 3% | 1% |
Incident location and hospital arrival
The location of the incidents leading to attendance at A&E was recorded as “home” for 136 cases (30%), “public place” for 30 (7%), and “other” for 277 (62%); the incident location were unrecorded for the remaining 6 (1%). Two hundred and forty-five A&E attendances (55%) were emergency ambulance arrivals.
The majority of A&E attendances for deliberate self-harm were self-referrals (67%); 15% were referred by the police or emergency services and 18% were referred from other sources.
For hospital admissions, the third digit of the diagnostic ICD-10 code indicates the location of the self-harm incident, and this is displayed in Table 4.4. Where the location was specified, the majority of incidents occurred at home (87%). Two per cent occurred in schools or another institution or public administrative area. However, for 42% of self-harm admissions, the location of the incident was not specified.
Table 4.4. Count of self-harm hospital admissions by location (third digit of ICD-10 code, 2012/13 – 2013/14)
Data suppressed for cells with value smaller than five to prevent deductive disclosure.
| Location | Admissions |
| Home | 212 |
| School, other institution and public administrative area | 6 |
| Sports and athletics area | <5 |
| Street and highway | <5 |
| Trade and service area | <5 |
| Farm | <5 |
| Other specified places | 18 |
| Unspecified place | 180 |
Forty-three per cent of self-harm A&E attendances and 61% of self-harm hospital admissions were at West Middlesex hospital, with Kingston hospital accounting for the next largest proportions (24% and 26% respectively, Figure 4.14 and Figure 4.15). A&E attendances were more widely distributed across hospitals than admissions.
Figure 4.14. Count of self-harm A&E attendances by provider (2012/13 – 2013/14)

Figure 4.15. Count of self-harm hospital admissions by provider (2012/13 – 2013/14)

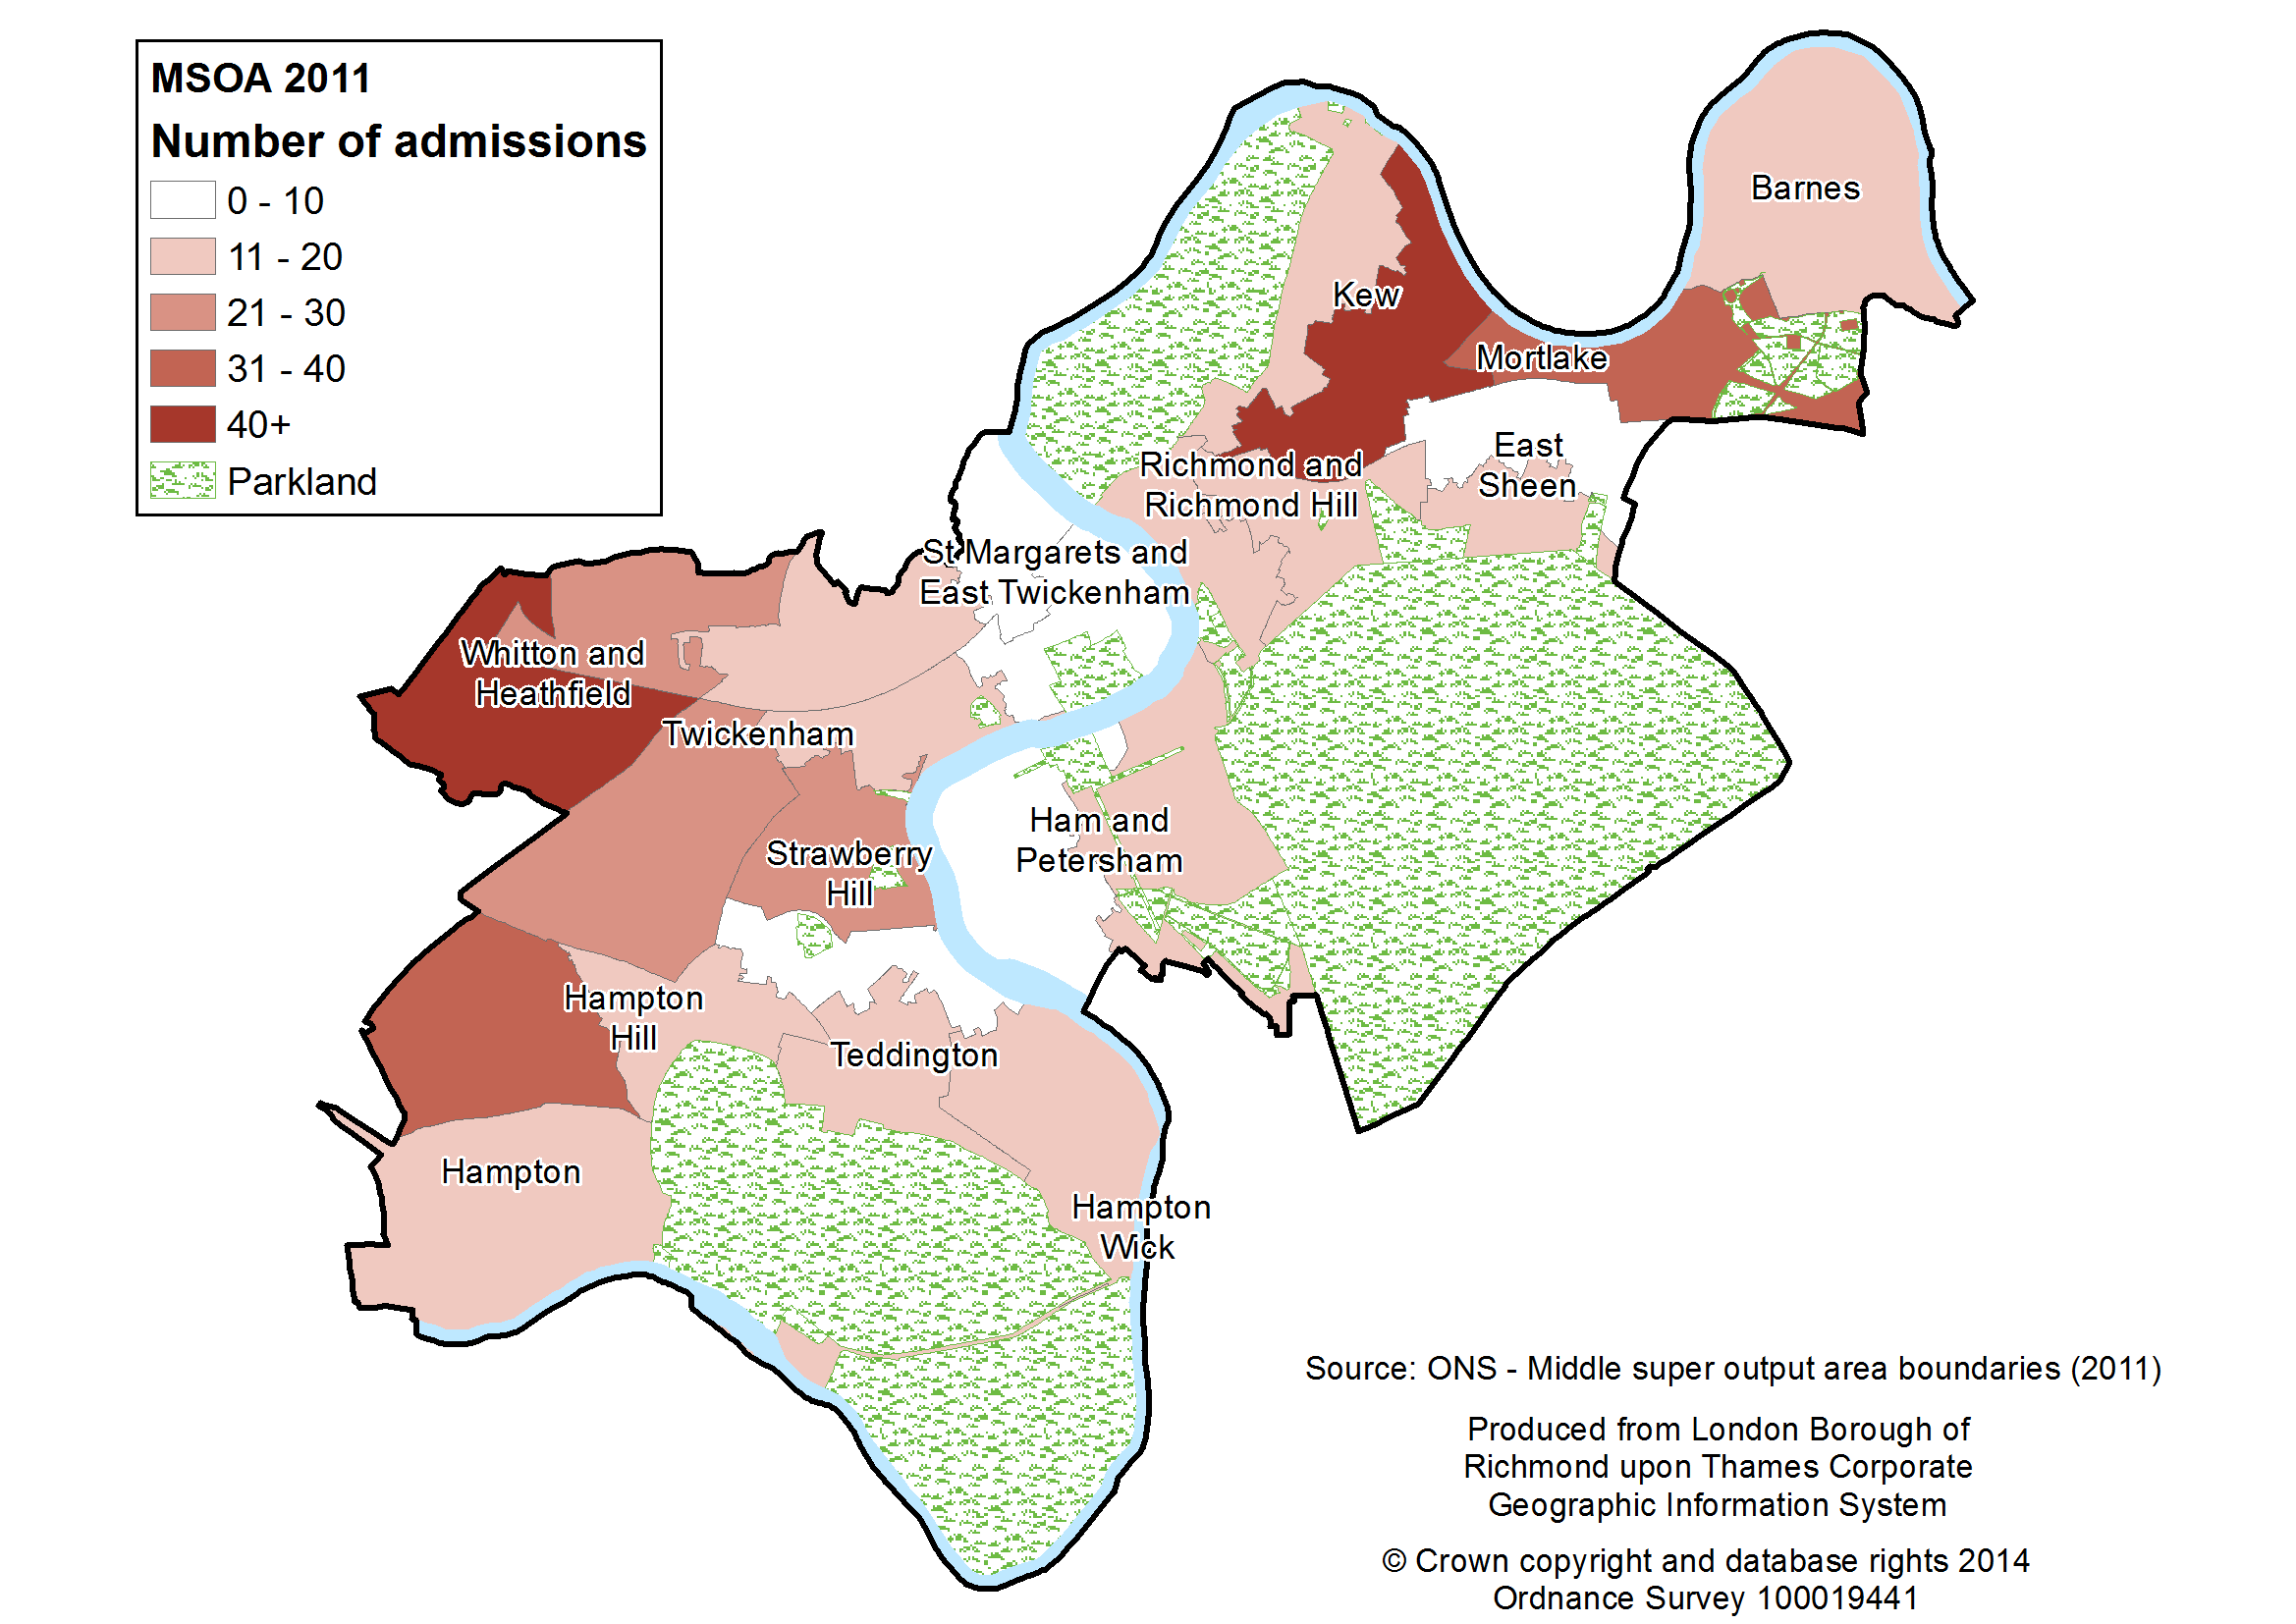
Figure 4.16 and Figure 4.17 map the data by patient’s place of residence. The numbers of both self-harm A&E attendances and admissions were notably higher in the areas of Whitton and North Sheen/South Kew than elsewhere. Conversely, numbers of self-harm attendances and admissions from the area of St. Margarets and East Twickenham were low.
Figure 4.16. Map of self-harm A&E attendances by medium super output area (MSOA, 2012/13 – 2013/14)
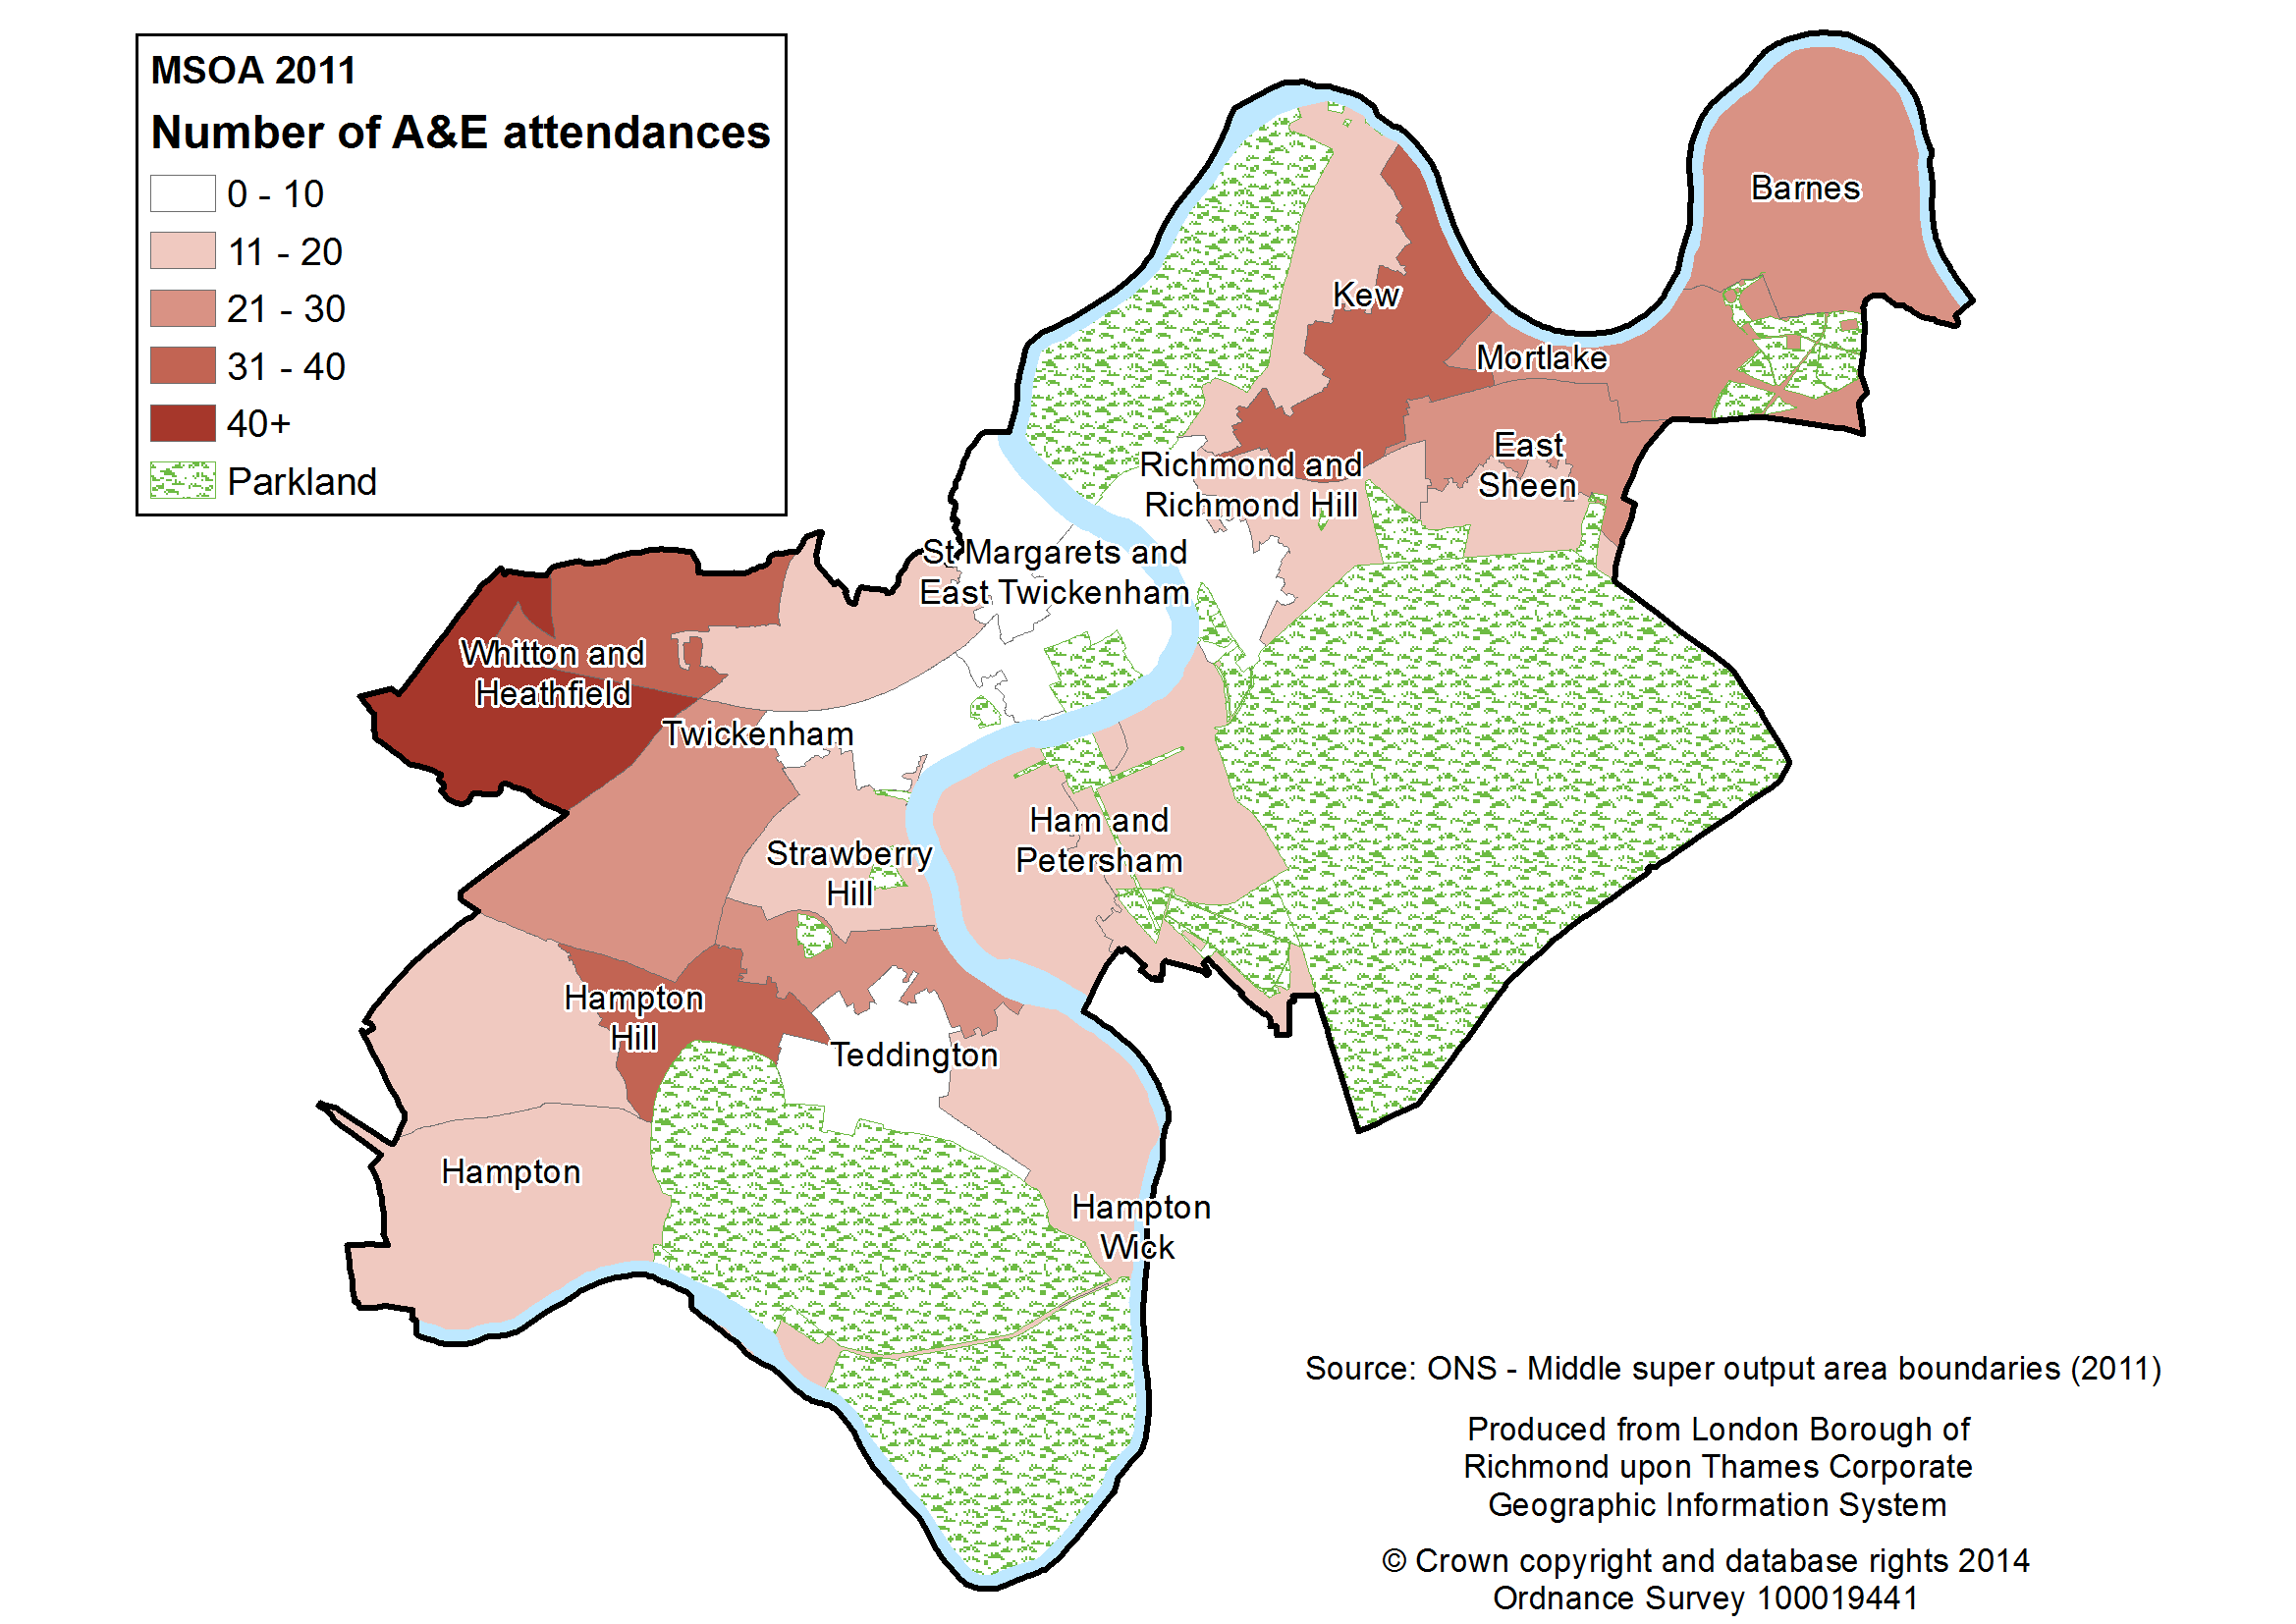
Figure 4.17. Map of self-harm hospital admissions by medium super output area (MSOA, 2012/13 – 2013/14)
Outcome and follow-up
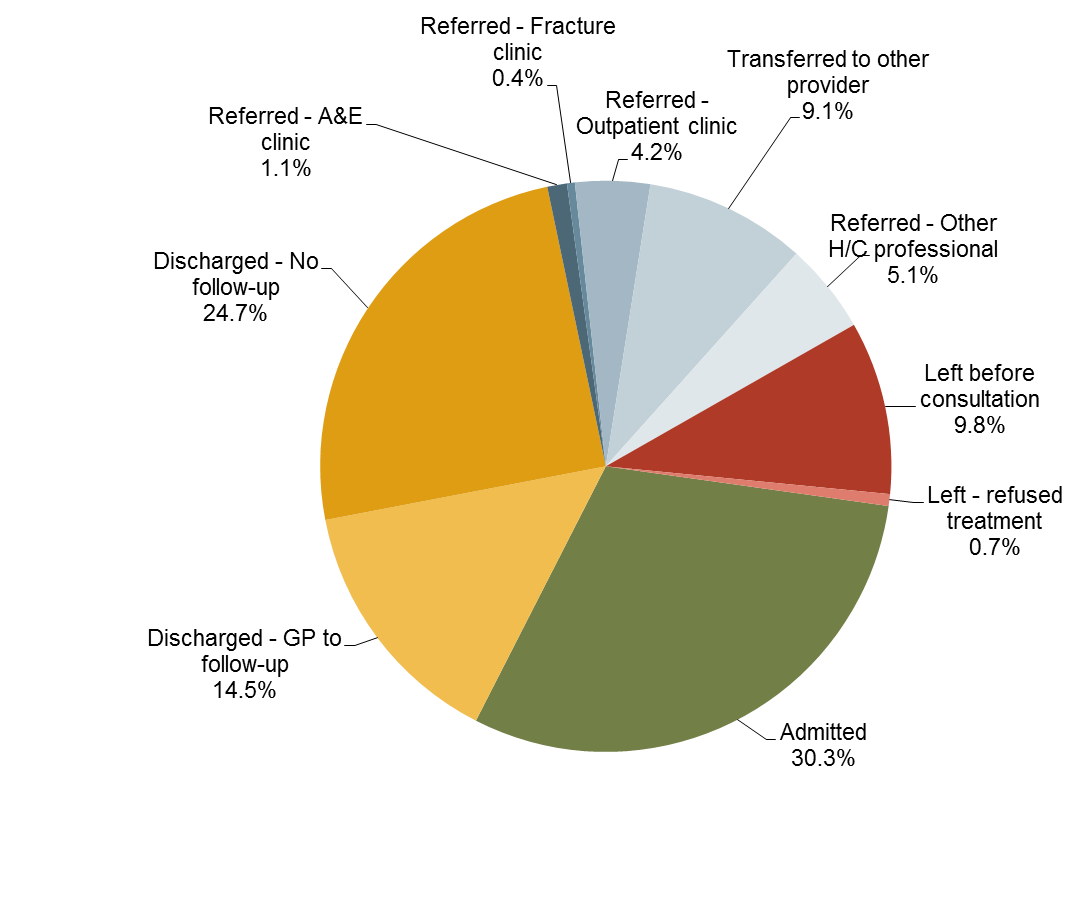
Information on how A&E attendances end (disposal) indicates that 11% of people visiting A&E for self-harm left without treatment (10% leaving before being seen for treatment and 1% refusing treatment). Fifty per cent were admitted for further treatment or referred to an A&E, fracture or outpatient clinic. Thirty-nine per cent were discharged with no follow-up treatment required (25%) or follow-up treatment to be provided by the patient’s GP (14%).
Figure 4.18. Disposal of A&E attendances for deliberate self-harm (2012/13 – 2013/14)
Limitations of local data
Of the 449 A&E attendances recorded as deliberate self-harm, only 136 were admitted to hospital. This is noticeably lower than the number of admissions from A&E which were given a self-harm-related diagnosis in the same time-frame (418). This failure to correspond suggests that A&E data substantially underestimate the true number of A&E attendances for deliberate self-harm.
It may be assumed, therefore, that the true figures are higher than reported. If under-reporting varies systematically according to any of the factors analysed above (such as age, sex, arrival method) this may introduce bias into the results. Nevertheless, this analysis provides an objective record of both the volume of self-harm related hospital activity in Richmond borough and the patterns which are observable in this activity.
Summary of self-harm audit
In Richmond in 2012/13-2013/14, self-harm accounted for 0.4% of A&E attendances and 1.1% of hospital admissions. The majority of self-harm admissions were due to self-poisoning (92%) and 6% were recorded as self-harm by a sharp object. The highest numbers and rates of both self-harm related A&E attendances and hospital admissions were in females age 15-24, although males aged 20-24 also experienced relatively high rates of self-harm admissions. A smaller peak was identified in females aged 50-54 for A&E attendances. There is some evidence that the white British ethnic group made up a greater than expected proportion of self-harm attendances and admissions. Home was the location of the incident leading to the majority of self-harm hospital admissions (87%). Relatively high numbers of self-harm A&E attendances and hospital admissions came from North Sheen/South Kew and Whitton areas and relatively low numbers came from the area of St. Margarets and East Twickenham. Eleven per cent of people attending A&E for deliberate self-harm left without receiving treatment. Comparing the number of admissions from A&E to hospital for self-harm between the two datasets suggests self-harm is particularly under-recorded in A&E.
4.4. Findings from the audit of suicide data from the Office of National Statistics for Richmond upon Thames
According to the PCMD extract supplied by the HSCIC, between 2006 and 2013, 94 suicides (death due to intentional self-harm or poisoning/injury of undetermined intent) in Richmond residents were registered[14]; an average of 12 per year. A further 22 suicides in non-residents who died within Richmond borough were registered.
Trend
As Figure 4.19 indicates, the number of Richmond-related suicides per year is small (under 20) and thus is subject to substantial year-on-year variation.
Figure 4.19. Number of suicides in Richmond residents and non-residents with a place of death in Richmond borough 2006-13, PCMD extract

However, by pooling data over three years, the trend can be more readily discerned. Figure 4.20 shows the age and sex standardised suicide rate per 100,000 for Richmond, London and England.[15] It can be seen that the rate in Richmond has generally been lower than London and England. However, over the past decade, the London and England rates have fallen, whilst the Richmond rate has risen slightly and is no longer significantly lower.
Figure 4.20. Comparison of suicide rate, per 100,000, 3 year rolling average, 2001-13, PHOF 4.10
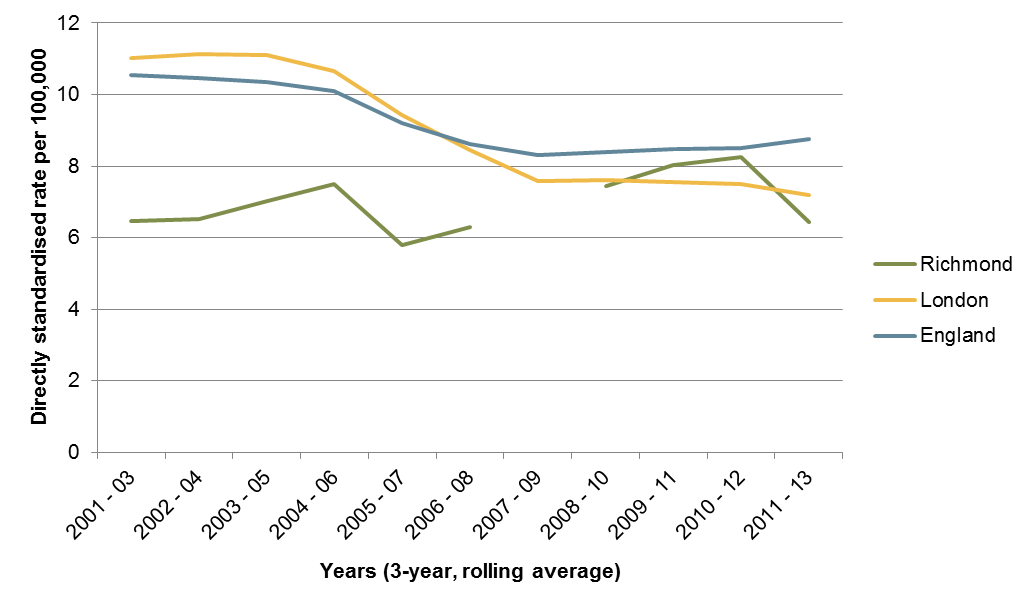
Data for 2007-9 suppressed due to small numbers.
Age and sex
Thirty-seven (39%) of the suicides registered between 2006 and 2013 in Richmond were in females and 57 (61%) were in males. This is more equal than may be expected: nationally, males account for about three quarters of all suicides.6
The age distribution for deaths is shown in Figure 4.21 and Figure 4.22, broken down for males and females. Over half the deaths (52%) occurred in the 35-54 year old age group.
This pattern is strongly mediated by the age structure of the Richmond population, which has a large proportion of 30-50 year olds. When the number of suicides is adjusted for the number of people in each age band, by calculating age-specific rates, the suicides in older age bands become more noticeable (see Figure 4.22). Whilst the number of suicides in over-75s was fewer than half the number in the 45-54 age band, the rates of suicide in these two age bands were much more similar. Similarly, for the over-75 age band, although the number of suicides in women was similar to those in men, there is a smaller number of older males than females alive in Richmond, and consequently the rate per 100,000 was higher in men.
Figure 4.21. Total number of suicides by age band and sex (2006-13)

Figure 4.22. Suicide rate per 100,000 population by age band and sex (average per year over 2006-13)

Figure 4.23. Death rates from Intentional Self-harm and Injury of Undetermined Intent by five-year age band and sex, England 2012 – Department of Health[16]

National data demonstrate a higher rate of suicides in those aged 35-60. For example, see Figure 4.23, which shows the suicide rate by age and sex in England in 2012. Comparing this with Figure 4.22, the pattern appears to be reflected in Richmond; although the effect is less pronounced.
Furthermore, it can be seen that, whilst the suicide rate is much higher in males than females for all age groups in England, in Richmond, this is only true for the younger age groups. In Richmond, for the age groups 45-54 years and above, the suicide rates are similar across the sexes.
The locally-produced figures reflect the pattern across the broader age groups for males (data for females are suppressed due to small numbers), published by Public Health England (Figure 4.24).
Figure 4.24. Suicide rate per 100,000 population by age band by sex (average per year over 2009-13) – Public Health England[17]
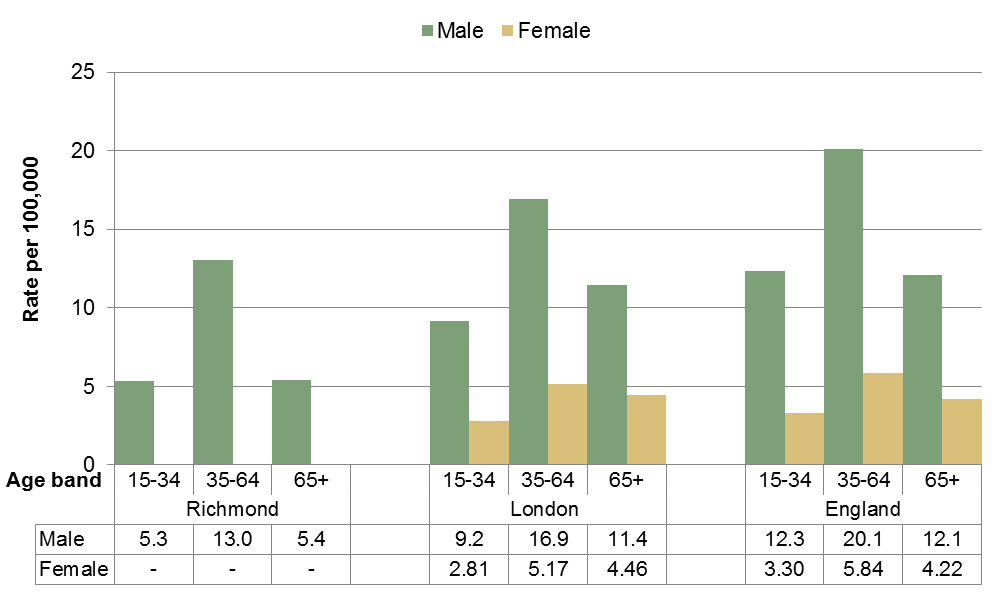
Data suppressed for females at local authority level due to small numbers
Method of suicide
Of intentional deaths and those where intent remained undetermined between 2006 and 2013, 33% were due to poisoning, 31% were due to hanging, strangulation and suffocation and 36% were due to other methods (Figure 4.25). The distribution varied by sex, with a greater proportion of males dying by hanging, strangulation and suffocation than females. Comparing this cohort of Richmond deaths to those in England in 2013, it can be seen that the proportion of deaths due to poisoning were higher in Richmond (33% compared to 23%). Although a higher proportion of females died from poisoning than males, this effect is driven by the difference in the proportion of males dying from poisoning in Richmond (30%) compared to England (19%). Likewise, the proportion of deaths due to other methods was higher in Richmond (36%) than in England (24%). On the other hand, a far smaller proportion of Richmond deaths were due to hanging, strangulation and suffocation (31%) compared to England (54%).
Figure 4.25. Suicides in Richmond and England by method (ICD10 code of underlying cause of death) and sex[18]

These figures are not age-standardised, so observed differences between Richmond and England could be due to differences in the age structure of the two populations.
Location of death
Suicides in residents and non-residents in Richmond borough between 2006 and 2013 were mapped. Deaths by poisoning and asphyxia were distributed across the borough, mostly at private residences. Deaths by hanging also followed this pattern, although a larger proportion were in public, albeit secluded places. Deaths by train impact were clustered around stations, with three railway stations in the borough (Richmond, North Sheen and Mortlake) having multiple incidents. There were clusters of deaths by drowning at Richmond Bridge and Chiswick Pier, though, due to the effect of the current and tide, the location of drowning deaths may not represent the location of the mortal incident.
4.5. Findings from an audit of inquest files from the West London Coroner’s Court for Richmond upon Thames
Year of death, year of inquest and verdict
This audit was completed for all deaths with a coroner’s verdict of act of suicide and self-harm; dependence on drugs; misuse of drugs; open verdict; and all other narrative verdicts. There is a lag between the year of death and conclusion of inquest, so that the deaths included in the audit go back to 2003 (see Figure 4.27). There were 105 deaths in total from the West London Coroner’s Office for Richmond upon Thames that fulfilled the inclusion criteria from 2006-2013, an average of 13 conclusions of coroner inquests per year.
Figure 4.27. Number of cases included in the audit by year of death and year of inquest

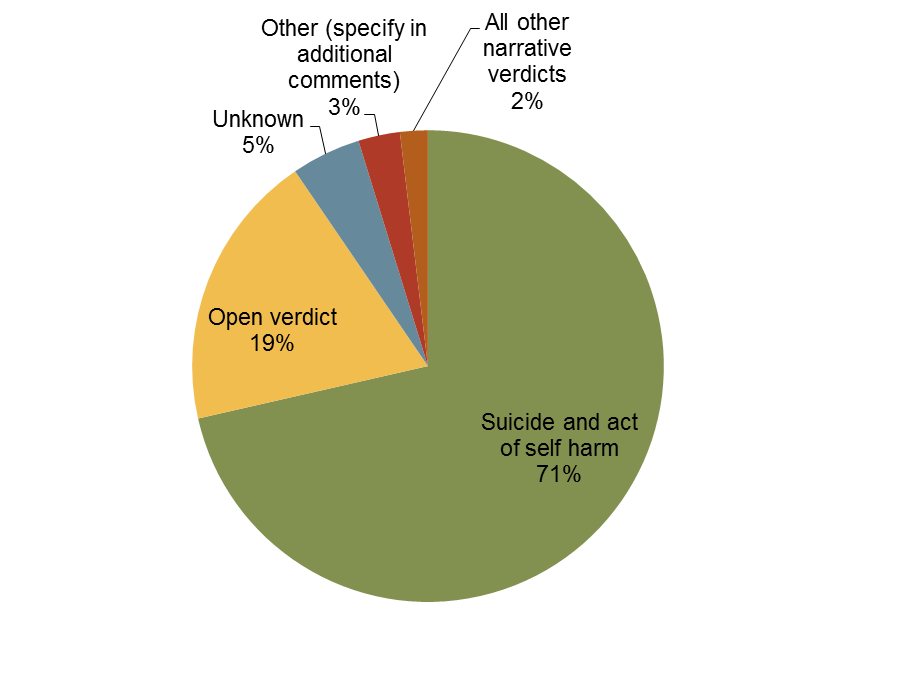
The vast majority of deaths audited had a verdict of suicide and self-harm, see Figure 4.28.
Figure 4.28. Proportion of cases by verdict
Age and gender
42% of the coroner’s cases included were for deaths in women. The rest, 58%, were men, there were no cases in transgender individuals. This reflects the findings in section 4.4.
The age distribution for deaths is shown in Figure 4.29, broken down for males and females. Only deaths for individuals aged 15 and over were included in the audit. This supports the findings in section 4.4.
Figure 4.29. Number of cases by age band and sex

Method of suicide
The most common cause method for ending life in Richmond upon Thames between 2006 and 2013 was poisoning for men (33% of all male deaths) and women (32% of all female deaths). The second most common method for men was hanging (23%), followed by ‘unascertained’ (11%) and going in front of a train (10%). For women, the second commonest method was drowning (18%) followed by ‘other’ (16%) and hanging (11%) – see Figure 4.30. Men were more than twice as likely to end life by hanging; women were more than twice as likely to end life by drowning.
Figure 4.30. Proportion of deaths by method and sex
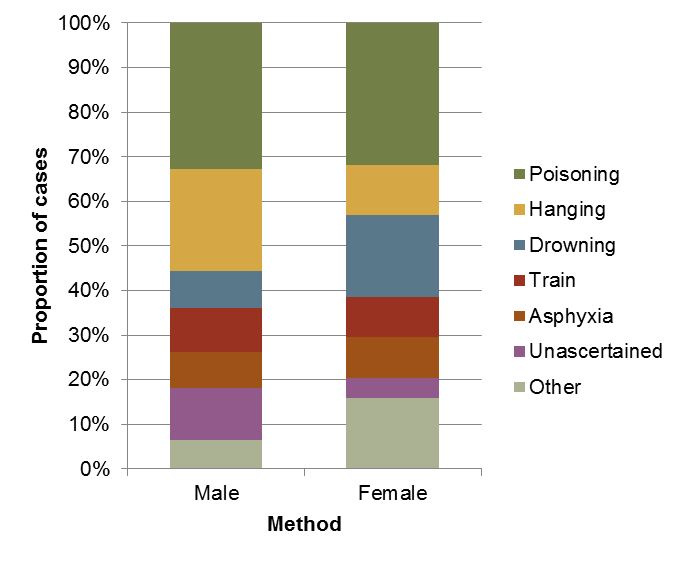
Poisoning was more common for those aged 55 years old and over (39% of deaths compared to 29% of deaths in those under 55 years of age). Hanging was more common for deaths in people under 45 years of age (35% of deaths compared to 8% in those over 45 years old). Going in front of a train was also commoner in those under 35 years old (17% versus 7% for those over 35 years).
Marital status
The most common marital status for those included in the audit was single, at 40% of the total. There were significant gender differences, as shown in Figure 4.31. Men were more likely to be single (49% of men were single and 27% of women), while women were more likely to be married (34% versus 21%) and widowed (16% versus 8%).
Figure 4.31. Marital status of cases by sex
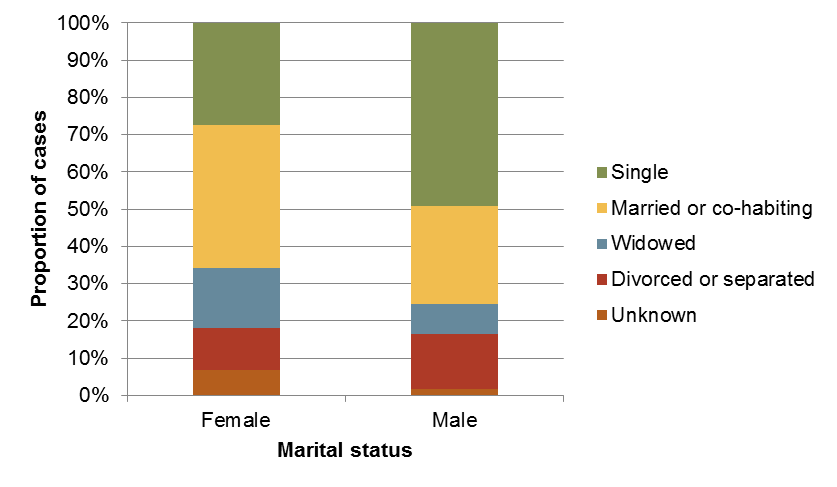
Different marital status correlated with different rates for methods of ending life. Those who were single were most likely to die by hanging, more so than most other groups (26% versus 18% overall). For every other marital status (excluding those with unknown marital status), poisoning was the commonest method of ending life. Those who were married were also more likely to die by drowning than other groups (18% versus 12% overall) or by going in front of a train (14% versus 10% overall). Those who were widowed were more likely to die by drowning (17% versus 12%) and poisoning (58% versus 32%). Those who were divorced were more likely to die by hanging (27% versus 18%) and poisoning (45% versus 32%).
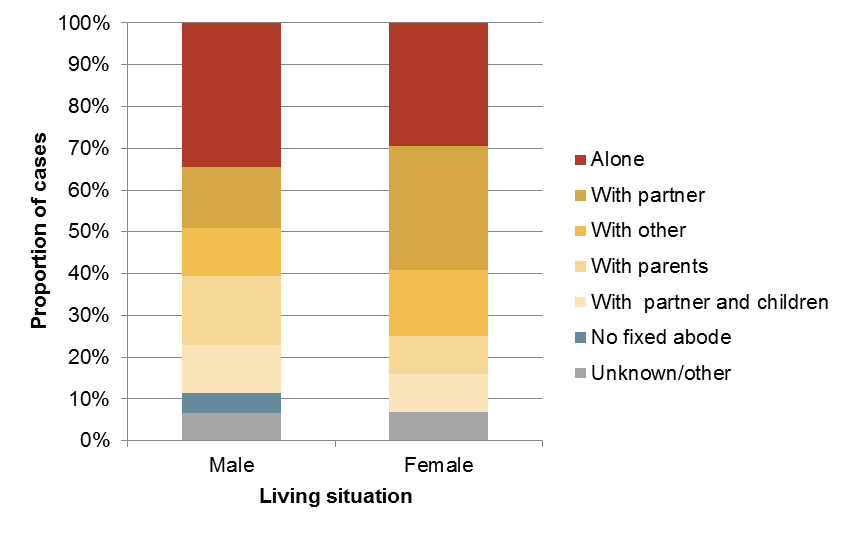
Living circumstances
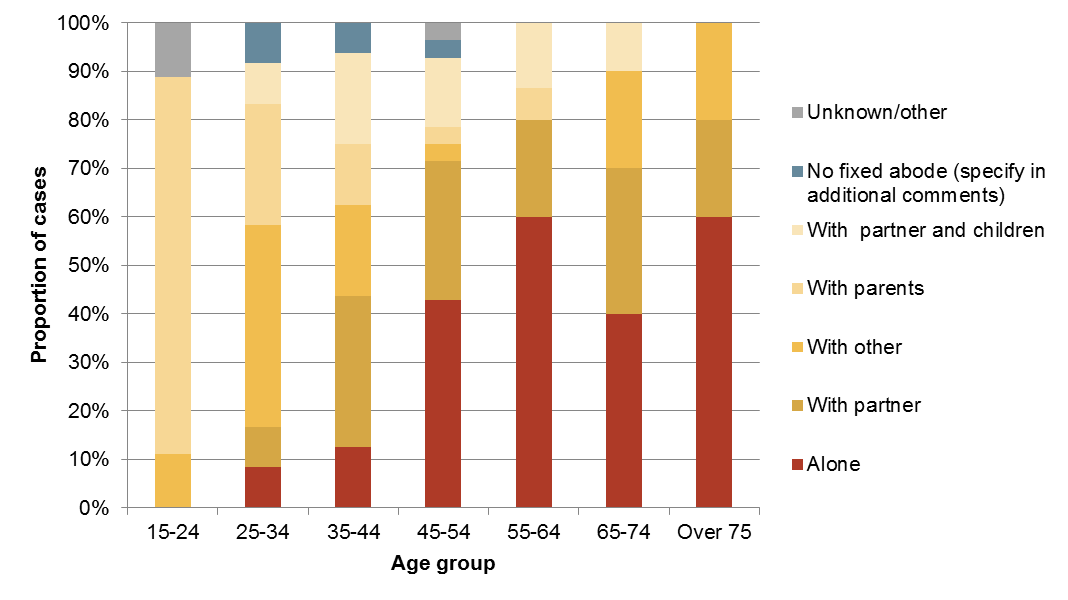
The single commonest living situation for those included in the audit was living alone (32%). Women were just as likely to live with a partner (30%) as live alone (30%). Men were more likely to live alone than any other living situation. Women were more likely than men to live with a partner (30% versus 15%) and more likely than men to live ‘with other’ (16% versus 11%). Men were more likely than women to live with parents (16% versus 9%), see Figure 4.32.
Figure 4.32. Proportion of deaths by living situation and sex
There were also significant differences in living situation by age (see Figure 4.33). Those aged 45 years old and over were more likely to live alone (48% lived alone versus 8% of those under 45 years old). Those aged between 35-74 years of age were more likely to live with a partner or with a partner and children than other age groups (41% versus 12%). Those aged 15-24 years of age were most likely to have been living with their parents (64% of this age group were living parents at the time of death). Those aged 25-34 years of age were also more likely to have been living with parents than those aged 35 years old and over (25% versus 5%).
Figure 4.33. Proportion of deaths by living situation and age
Employment status
The single most common employment status was employed (30%) followed by retired (22%), unemployed (18%) and not known (12%). Men were more likely than women to be employed (38% versus 18%) or unemployed (21% versus 14%). Women were more likely than men to be retired (27% versus 18%) or studying (9% versus 3%).
There was a variation in employment status in line with employment age and retirement age. Those age 35-54 years of age were more likely to be in employment (43%) than any other age group including younger people aged 15-34 (where 35% were in employment). Young people aged 15-24 were more likely to be studying than any other employment status (45%). 8% of those aged 25-34 were also students while 0% of other age groups were students. Those aged 25-64 were more likely than other age groups to be both unemployed (25% versus 3%) and not working due to sickness or disability (8% versus 0%).
Figure 4.34. Employment status of cases and wider Richmond population

Source: ONS Census 2011
Only thirty per cent of suicide cases were recorded as being employed, which is substantially lower than the wider population of Richmond borough.[19] As may be expected following this observation, the proportion of suicide cases who were retired or unemployed was larger than in Richmond overall (see Figure 4.34).
Physical health
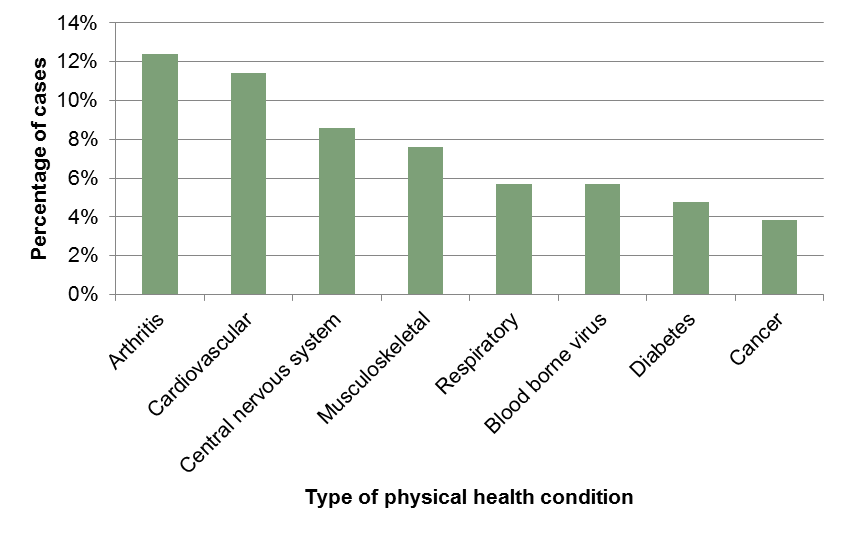
A physical health problem was recorded in 51% of cases and there was no significant difference in men (52%) and women (50%). Those aged 50 years and over were nearly twice as likely as those under 50 years to have a physical health problem recorded (67% versus 40%). To give this some context, in the 2011 Census, 14% of the wider population of Richmond borough over the age of 15 reported their day-to-day activities were limited by a health problem or disability lasting at least 12 months. The proportion for those aged 50 years and over was 26% and for under-50s was 5%.19 Although these figures are not directly comparable (as the physical health problems recorded in suicide cases may not have been perceived as limiting day-to-day activities), they are suggestive of higher rates of physical health problems in suicide cases, especially the younger age-groups. The most common physical health condition in suicide cases was arthritis, followed by cardiovascular disease and disorders of the central nervous system. 6% of individuals had a blood borne virus (one or more of HIV, hepatitis C and hepatitis B).
Figure 4.35. Proportion of cases with physical health condition, by type
Mental health
Of those included in this audit, 74% were recorded as having any history of mental illness. Women were slightly more likely to have been recorded as having problems with mental health than men (77% versus 72%). Those aged under 75 years old were more likely to have been recorded as having a history of mental illness than those aged 75 years old and over (74% versus 64%).
Cases in the audit that were married were less likely than those of other marital status to have been recorded as having mental ill health (68% versus 77%). Those recorded as having a recent relationship breakdown were also less likely to have been recorded as having mental ill health (61% versus 82% of those not recorded as recently having a relationship breakdown), as were individuals who lived with a partner and children at the time of death (64% versus 76% for all other living situations).
In terms of employment status, people who were unemployed, retired or not working due to sickness were more likely to have been recorded as having mental ill health than all other categories (81% versus 68%). Those who ended life by poisoning, going in front of a train or where the method was unascertained were also more likely to have been recorded as having had problems with mental health than those who ended life by other means (87% versus 62%).
Figure 4.36 shows the prevalence of the three main mental illness symptoms that were reported in the coroner’s files of those audited. Note that there is overlap where some individuals had mixed symptoms in different combinations. Of those reported to have experienced affective symptoms (mood disorder), 62% experienced affective symptoms only. Of those reported to have experienced anxiety, only 12% were reported to have experienced this symptom alone. For functional (schizophrenic) symptoms, 42% were reported to have functional symptomatology only. Cases of women who died were more likely to have experienced anxiety and functional symptoms than men.
Figure 4.36. Proportion of cases with main mental illness symptoms

Those who died as a result of poisoning were more likely to have suffered with all three symptom types (68% had affective symptoms versus the overall average of 60%; 24% had anxiety symptoms compared to the average of 16%; and 32% had functional symptoms compared to the average 23%). Those who died by going in front of a train were at higher risk for having had anxiety symptoms (20% compared to the average 16%) and at much higher risk for having experienced functional symptoms (70% versus the average 23%). Those who died from hanging had similar rates of affective symptoms to the average (63% versus 60%) but were less likely to have experienced anxiety (5% versus 16%) and functional (5% versus 23%) symptoms.
Contact with mental health services
Figure 4.37 shows the level of mental health service input for cases in this audit prior to death. Cases were categorised according to previous severity: those who were previously psychiatric in-patients may also have been in touch with community mental health teams and have undergone counselling or CBT but the greatest level of input is recorded here to give an idea of severity without overlap.
Figure 4.37. Proportion of cases with previous mental health input

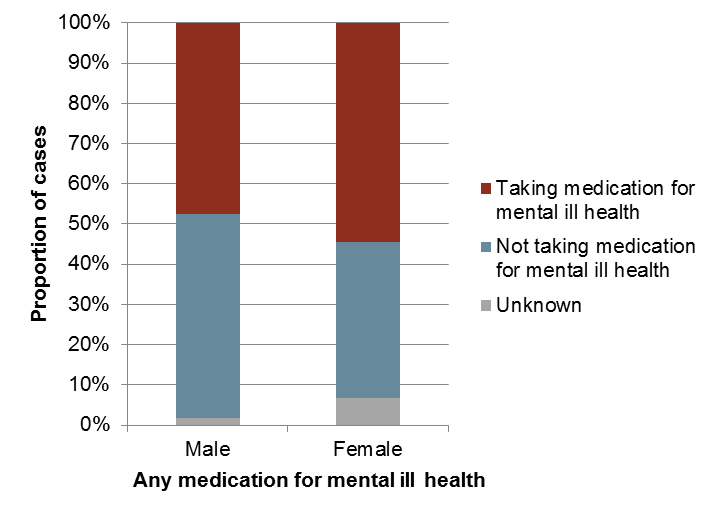
Figure 4.38 shows the number of cases on medication for mental ill health at the time of death. Women were more likely to have been on medication for mental ill health than men (55% versus 48%). Those aged 75 and over were less likely than those under 75 to have been taking medications for mental ill health at the time of death (27% versus 53%). Married individuals were less likely than those of other marital status to have been taking medication for mental illness (46% versus 55%). Those who were not working due to sickness or disability, students or unemployed were more likely than those of other employment status to have been taking medication for mental illness (75%, 67% and 63% respectively compared to 46% for those of other employment status). While retired individuals had higher rates of reported mental illness, their rates of having been taking medication for mental ill health do not differ significantly from the average (52% versus the average 50%).
In terms of method used to end life, those who died from poisoning and going in front of a train were more likely to have been taking medication for mental illness compared to other methods (62% and 70% respectively versus 41% for all other methods). This is in keeping with the fact that individuals who ended life by this method had higher rates of reported mental ill health.
Figure 4.38. Cases taking medication for mental ill health
Previous self-harm
In total, 39% of all cases were recorded as having a history of previous self-harm. Men were more likely to have a history of self-harm than women (43% versus 34%), see Figure 4.39. Those aged 75 years and older were less likely to have a history of self-harm than those aged under 75 (27% versus 40%). Unemployed individuals were significantly more likely than those of other employment status to have previously self-harmed (58% versus 37%).
Figure 4.39. Cases with previous history of self-harm

Cases with a history of financial problems or recent relationship breakdown had lower rates of previous self-harm than those who did not have these issues recorded (31% versus 42% and 30% versus 44% respectively). Those with a history of having been convicted of offences or probation service involvement were at higher risk of having previous self-harm (47% versus 39%). A history of alcoholism, substance misuse and mental ill health were also all risk factors for previous self-harm (64% versus 31% of those without a history of alcoholism, 57% versus 28% of those without a history of substance misuse and 49% compared to 13% of those with no recorded history of mental illness).
Figure 4.40 shows a breakdown of the different methods recorded for previous self-harm. Some individuals had used multiple methods previously.
Figure 4.40. Previous self-harm methods (some individuals are counted under more than one method)

Alcohol and substance misuse
42% of cases in the audit had a history of problems with alcohol. Men were significantly more likely to have had problems with alcohol than women (56% versus 23%). There was no consistent trend across age groups, but those aged 75 years old and over were less likely to have problems with alcohol reported (18% versus 45% of those aged under 75 years old). Those who were married were less likely than those of all other marital status to have problems with alcohol reported (21% versus 49%). Unemployed individuals were more likely to have had alcohol problems than those of other employment status (63% versus 37%). In terms of living situation, those who had no fixed abode and lived alone were more likely to have had problems with alcohol (67% and 59% respectively compared to the average 42%) and those living with a partner and children and with ‘other’ were less likely to have had problems with alcohol (18% and 14% respectively), see Figure 4.41.
Figure 4.41. Living situation and problems with alcohol

27% of cases were reported to have had a history of substance misuse. Men had higher rates of substance misuse than women (34% versus 16%). There was a clear trend with age: younger people were more likely to have a history of substance misuse than older age groups, see Figure 4.42.
Figure 4.42. Substance misuse by age group

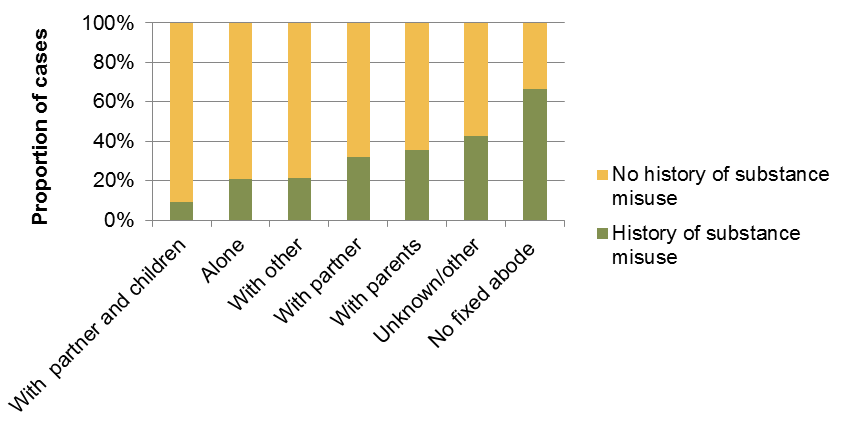
For employment status, those who were unemployed were had higher rates of recorded substance misuse (42% compared to the average of 27%). Retired individuals had much lower rates of substance misuse (4%). In terms of marital status, married individuals had significantly lower rates of recorded substance misuse (18%), while those who co-habiting, single, divorced or separated had higher rates (40%, 38%, 36% and 33% respectively). For living situation, those who lived with a partner (32%), with parents (36%) or had no fixed abode (67%) had higher rates of substance misuse, while those who lived with a partner and children had significantly lower rates of recorded substance misuse (9% compared to the average 27%), see Figure 4.43.
Figure 4.43. Living situation and substance misuse
With regards method, those who died from hanging were more likely to have had a history of substance misuse (53% compared to 21% of those who died by other means).
Figure 4.44. Employment status and substance misuse

Contact with substance misuse and alcohol services
16% of all cases were recorded to have been in contact with alcohol and substance misuse services. Rates of previous contact were higher for men, at 23% compared to 7% for women. Figure 4.45 shows the distribution of those recorded to have been in contact with substance misuse/alcohol services by age. Whilst the number of cases in contact with substance misuse/alcohol services peak in the 45-54 age group, the relative proportion of cases in contact with substance misuse/alcohol services is higher in the 25-34 and 55-64 age groups (Figure 4.46).
Figure 4.45. Number of cases in contact with substance misuse/alcohol services by age group

Figure 4.46. Proportion of cases in contact with substance misuse/alcohol services by age group

Life experiences and precipitating events
Financial difficulties
15% of cases were explicitly recorded as having financial difficulties at the time of death. This included such problems as difficulties with business and facing a major lawsuit; loss of life savings through a scam investment and over-indebtedness. Men had a slightly higher rate of recorded financial difficulty (18% versus 11% in women). Those aged 25-54 had higher rates than other age groups (22% versus 6%). Those who were married or single had higher rates of recorded financial difficulty than those of other marital status (12% and 19% respectively versus 6% for those of other marital status). Those living with a partner and children or with ‘other’ had higher rates of recorded financial difficulties than those in other living situations (36% and 21% respectively versus 11% for all others). Employed and unemployed individuals had the highest rates of recorded financial difficulties (26% for both groups compared to 5% of those of all other employment status). A quarter of those recorded as having financial difficulties died by going in front of a train and the rate of financial difficulties for those ending life by this method was increased (40% of those who went in front of a train had financial difficulties compared to 15% of cases overall). Those with financial difficulties did not have significantly different rates of substance misuse, alcoholism, mental ill health or physical ill health.
Relationship difficulties
Over a fifth (22%) of cases were found to have had relationship difficulties at the time of death. Men in the audit were twice as likely to be experiencing relationship difficulties as women (28% versus 14%). Those who were widowed or single were least likely to have been experiencing relationship difficulties (0% and 17% respectively versus 34% for all other groups). In terms of living situation, those who lived with ‘other’ were most likely to be experiencing relationship difficulties (43%) while those who lived alone were least likely (6%). Those who were employed were most likely to have been experiencing relationship difficulties at the time of death (42% compared to 14% for all those of other employment status). Those who were experiencing relationship difficulties were most likely to end life by hanging (39%), asphyxia (17%) or drowning (17%). Those who ended life in these ways were also at higher risk of having experienced relationship difficulties (47%, 44% and 31% respectively compared to the average of 22% overall experiencing relationship difficulties).
Cases with no history of alcohol abuse were more likely to have been experiencing relationship difficulties (25% versus 20% with a history of alcohol abuse). Similarly, those with no history of mental illness (39% versus 18% for those with recorded mental illness), no history of physical illness (32% versus 15% with recorded physical illness) and no history of previous self-harm (27% versus 17% with a history) were more likely to have been experiencing relationship difficulties. Those who had a history of substance misuse were, however, at higher risk of having been experiencing relationship difficulties. These findings are in keeping with certain case studies, which indicate that relationship breakdown may be an acute stressor which precipitates suicide in those with no history to indicate risk.
Violence
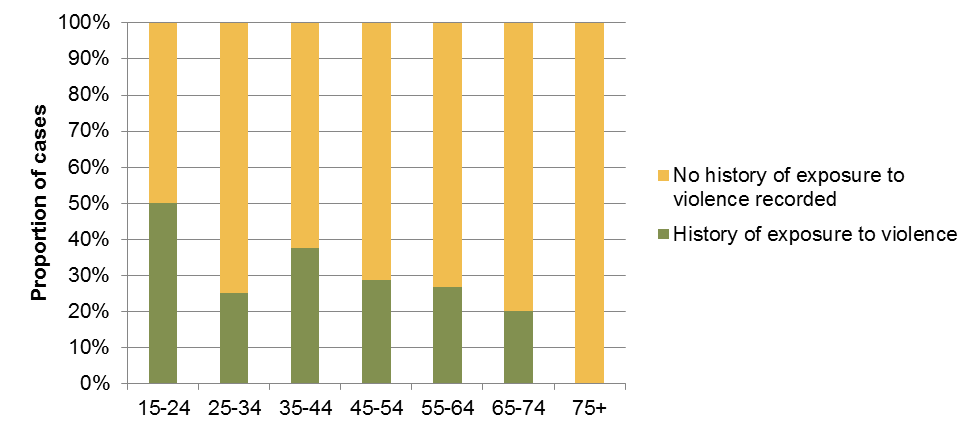
27% of individuals included in this audit had experience of violence, excluding a history of self-harm or violence to oneself. Men were more likely to have been recorded as having experienced violence (30% versus 23% of women). Younger people were at higher risk of having been exposed to violence, see Figure 4.47.
Figure 4.47. History of exposure to violence by age group
A history of violence was more common in those who were separated or divorced (43%) or co-habiting (60%). Those with no fixed abode (67%), living with a partner and not with children (45%) or living with parents (36%) had higher rates of recorded experiences of violence. Those living with a partner and children had lower rates of recorded experiences of violence (0%). Individuals who were unemployed were more than twice as likely as those of other employment status to have experienced violence (53% versus 22%).
Criminal offences
Sixteen per cent of individuals included in the audit had a recorded history of criminal offence, incarceration, probation service involvement or were suspects in a criminal investigation. The proportion was much higher in males (25%) than females (5%). Offences included murder, assault, robbery, burglary, criminal damage, possession of an offensive weapon, drunk and disorderly and sexual assault, although, in many cases, specifics were not recorded.
Cases in older age groups were less likely to have a criminal history recorded (see Figure 4.48). This could reflect a recording bias; criminal offences are more often committed when younger; historical offences and spent convictions may not be known to those involved in the care of older people.
Figure 4.48. Proportion of cases with recorded history of criminal offence, prison or probation services involvement

Those who were married were less likely to have a known history of criminal offence (7%) than the cohort as a whole (16%). As might be expected, those with a history of violence were more likely to have a known history of criminal offence (43%) than those with no history of violence (6%).
Cases with a history of criminal offence were more likely than those with no such history to have a history of alcohol abuse (82% vs 34%) and substance misuse (47% vs 23%) but were no more likely to have a history of mental illness (65% vs 76%).
Twenty-nine per cent of cases with a history of criminal offence died by hanging, making this method almost twice as common than in those with no such history (16%).
5 Framework: Local Approaches and Services
This section sets out the strategic framework for prevention of suicide and self-harm.
The overall aim and desired outcome is:
- To reduce the rates of suicide and self-harm in the Richmond population. –
as measured by Public Health Framework Outcome indicators
The objectives are:
- Reduce the risk of suicide in key high-risk groups (including young and middle aged men, people in the care of mental health services, people with untreated depression, those with a history of self-harm and people who misuse drugs and alcohol)
- Tailor approaches to improve mental health among specific groups (above)
- Prevent self-harm among young people
- Reduce access to the means of suicide
- Provide better information and support to those bereaved or affected by suicide
The framework sets out actions in each of these five areas- highlighting evidence-based interventions and current services and developments.
It takes account of the evidence about what measures are likely to be effective for reducing suicide and self-harm, (including NICE guidance).
The framework also includes comments from consultations including discussions at a multi-agency workshop (September 2014) involving those working in mental health, community safety, substance misuse, social care, primary care, and children’s services and also a number of service users and representatives.
A number of priority areas are set out in section 6.
| 1. Reduce the risk of suicide in key high-risk groups | |||
| High risk groups | Examples of evidence based interventions | Responsibilities | What is the position in Richmond?
Priorities for development underlined |
| Young and middle aged men | Improve service access for men to appropriate information, self help and support for mental health and wellbeing. Use community locations frequently by men for service delivery (job centres, youth centres, sports venues, pubs and clubs)
Improve extent that emotional health support is offered in workplaces with a largely male workforce – in line with NICE guidance [20]-covering corporate and HR strategy, flexible working, and the role of line managers. |
Council /public health
Employment services Leisure & recreation Voluntary & community groups |
Richmond Council’s adoption of the London Healthy Workplace Charter includes the promotion of mental wellbeing across a range of workplace policies and effective management practices (phase 1)
Phase 2 involves working as an exemplar to support local employers to adopt the Charter and work towards meeting all of the standards, including mental health and wellbeing |
| People in the care of mental health services, including inpatients | Providing risk assessment and management as part of all clinical assessment and care planning by staff working with high risk groups[21]
Mental health home treatment /crisis intervention service Effective care pathways between key services (A&E, primary care, secondary care, inpatient care, community care) on hospital discharge Signposting to Crisis Lines-Samaritans, Saneline |
SWLStG NHS Mental Health Trust
Acute service providers Richmond Wellbeing Service CAMHS CCG/Council commissioners Adult Social Care GP & primary care staff Tertiary MH services – Personality Disorder; Perinatal MH; Forensic, etc. |
Adult psychiatric liaison service-
At Kingston & West Middlesex Hospitals (new service specification 2015/16- monitor effective delivery)
Mental Health Crisis line -24/7 access (including crisis leaflet)
Sign post to Samaritans, Saneline, Social services MH Crisis and Home treatment team –treat and support clients discharged from ward or on leave; and referral/ refer/access specialist services as required (alcohol, drugs, psychotherapy etc). Richmond Wellbeing Service –liaison psychiatry and IAPT |
| People with a history of self- harm | Implement NICE self-harm pathway (clinical guidelines for short and long term management of self-harm[22]);
including · Providing referral to psychological assessment of people who self-harm as routine practice in A&E/acute settings · Ensuring effective communication and sharing of information between emergency depts, mental health services, and GP practices in relation to patients who present having self-harmed |
A&E/acute secondary care, primary care, mental health services (CAMHS for under 18s-AfC, CCG)
Commissioners-CCG, Council/public health |
Psychiatric liaison service-
Kingston & West Middlesex Hospitals (adults) – new service specification -monitor effectiveness Monitor effective implementation pathway for management of self-harm among young people (CCG, AfC, Emotional wellbeing service Tier 3 CAMHS (SWLSTG), Acute providers) |
| People in contact with the criminal justice system
|
· Ensuring learning from investigations of deaths in or following custody to inform future prevention
· Providing mental health support information/liaison within police custody & court settings |
Police , probation/ community rehabilitation services, court settings, youth justice settings | Access to mental health assessment in custody/court, probation/ community rehabilitation settings
Drug Test on Arrest Kingston custody suite Alcohol Treatment Requirement (RIRS) Drug Treatment Requirement (RIRS) Integrated Offenders Management Scheme Early intervention initiatives, street triage, etc. Appropriate Adult service |
| 2. Tailor approaches to improve the mental health of specific groups | |||
| Risk groups
|
Examples of evidence based interventions | Responsibilities | What is the position in Richmond?
Priorities for development underlined |
| People with untreated depression:
including people with long term conditions (diabetes, cancer, heart disease, arthritis, COPD), and most being older people Lesbian, gay, bisexual and transgender Those socially isolated Carers |
Identify people early and provide effective & appropriate treatments for depression
Ensure protocols are in place for the identifying and assessing common mental health problems in primary care in line with NICE guidance (in response to known risk factors) , with referral to Richmond Wellbeing Service (IAPT) as appropriate[23] Ensure provision of training for front line staff in helping and care support roles:-focussing on: · Mental health awareness · Working with emotional health · Signposting to appropriate support · Suicide risk assessment & response |
Primary care/ Richmond Wellbeing Service
Commissioners CCG, Public Health/ Adult Social Care HRCH GP & primary care staff Social Care workers (home helps, residential care workers, etc.) Voluntary organisations |
Richmond Wellbeing Service –increase coverage and uptake of psychological therapies among high risk groups (target set)
Richmond Wellbeing Service –training of general practices ; and training programme on mental health and physical health CCG/Council –promotion /signposting of available services via Lifestyles prevention Hub from 2015. Promotion of mental health awareness and positive wellbeing messages via key campaigns eg. 5 ways to wellbeing via Lifestyles Prevention Hub from 2015 Lifestyles Services frontline staff access Mental Health First Aid training and No Health without Mental Health to support mental health awareness, identification and effective signposting. Use of WHO-5 questionnaire to Identify and support referral where appropriate of depression and low mental wellbeing in individuals accessing lifestyles services. Digital Mental Health Pilot Project- London wide (due to be operational 2016) . |
| People facing difficult social and economic circumstances | Training for front line staff who are in regular contact with people facing difficult social & economic circumstances (eg people working in housing associations, welfare, jobcentres, advice and support agencies)- in understanding & responding to emotional distress; providing information and guidance /signposting and referrals to specialist services (including mental health and substance misuse) | Council
Adult Social Care Access Team & related services Housing Voluntary service Job Centre |
Improve access to council support services –
Monitor new protocols for effective joint working across council services (housing, social care, benefits) and access as appropriate to mental health and substance misuse services Consider training needs of frontline staff |
| Ensure policy/HR deliver workplace led support for staff during periods of organisational change | CCG/Council
Providers Employers |
Council and CCG commitment to Workplace Charter implementation | |
| People who misuse drugs and alcohol | Ease of access to information, support and treatment to substance misuse services
Providing risk assessment and management as part of routine clinical assessment and recovery planning and case management |
Partners- Strategy for prevention of substance misuse
Primary Care/GPs, Community pharmacies New Richmond Integrated Recovery Service (RIRS) for substance misuse (CRI & SWLSTG) Public Health /CCG |
Brief advice and intervention in primary care/pharmacies for alcohol prevention (LCS) being reviewed
Key elements of RIRS- delivery over 2 year 2015/17: · Improved access open access/self-referral (single point of contact), peer led support, assertive outreach, extended opening hours. · Integrated pathways, linking treatment and recovery support services. · Wide range of psychological therapies. Shared care scheme with general practice for the of alcohol and drugs misuse (2015/17). Agree protocol for access to services for those in crisis Agree pathway for alcohol liaison service linked to psychiatric liaison service |
|
3. Promoting resilience and reducing risks of suicide and self -harm among young people |
|||
|
|
Examples of evidence based interventions | Responsibilities | What is the position in Richmond?
Priorities for development underlined |
| Promotion and protection of emotional and social wellbeing/building resilience among young people and preventing risky behaviours | Adopt whole school approaches to promoting emotional wellbeing and preventing mental health problems and risky behaviours :
covering both universal and targeted approaches that foster skills & competencies to safely manage risk and promote resilience (in line with NICE guidance for primary & secondary education[24]) |
Partners -Joint strategy for the Emotional Wellbeing and Mental Health of Children and Young People in Richmond
(2012-15) Schools (governors, head teachers) PH commissioners/ School Health Service |
Anti-bullying policies
E-safety education Personal Social and Health Education (PSHE) Procurement of School Health Service includes strengthened role of school nurses to work with others (including CAMHS) to promote emotional wellbeing and address mental health difficulties Young Minds –pilot project |
| Range of youth support services and programmes focused on building resilience and reducing risks relating to range of behaviours/promoting healthy relationships and engagement in positive activities | AfC
Range of providers Voluntary services NHS children’s commissioners/Public Health |
Risky behaviour project (Youth Service)
Teenage Youth Support (11-18 years) Youth Enquiry Service Off the record counselling service Sexual health services Young people’s substance misuse service |
|
|
Early support and intervention for children and young people with emotional and behavioural problems |
Effective pathways for early detection and management of emotional difficulties and specific conditions (including self- harm, depression, eating disorders)[25]
With a focus on high risk groups: Young people in care, and leaving care Young offenders With SEND Misusing substances Living in difficult family circumstances Young carers |
AfC
SWLSTG CAMHS YP substance misuse service Safeguarding Voluntary agencies NHS children’s commissioners/Public Health/Council |
AfC Early Help Framework-Team around child /CAF approach/MASH/SPA for CAMHS
New Emotional health service (Tier 2 CAMHS) Monitor access via Single Point of Access for CAMHS Monitor effective implementation of pathways for self-harm, depression, eating disorders , and substance misuse Including ensuring implementation of NICE guidance for young people presenting with self-harm at A&E |
| 4. Reduce access to the means of suicide | |||||
| Risk locations | Examples of evidence based interventions | Responsibilities | What is the position in Richmond?
Priorities for development underlined |
||
| High-risk locations and railways | · Multi-agency working to discourage suicides at high risk locations, especially following a death
eg Including barriers/nets on bridges; provide emergency telephone numbers at high risk locations |
LA, Transport, Police, Planners, Developers, Emergency Services | Community Safety Partnership
Richmond Borough Resilience Forum /emergency planning Range of activities already in place (eg SW Trains) |
||
| Health and social care settings | · Assess the risk of vulnerable patients accessing opening windows or balconies as part of environments in care and hospital settings
· Review suicide risk reduction audit guidance associated with mental inpatient setting (eg 12 points to a safer service) |
Health & social care services, including mental health services | All health & social care providers –suicide prevention/risk reduction integral all relevant policies and meet quality standards relating to patient safety | ||
|
5. Provide better information and support to those bereaved or affected by suicide |
|||||
|
|
Examples of evidence based interventions | Responsibilities | What is the position in Richmond? | ||
| Those bereaved or affected by suicide | Provide emotional and practical support for families bereaved or affected by suicide | Primary care , mental health services
Adult Social Care Voluntary services |
Carers Hub Service (council/CCG)
Cruse Bereavement Care – Richmond |
||
| Have in place procedures for ensuring good quality family liaison with bereaved families with signposting to appropriate information support | Coroners and services involved in suicides (including police, pathologists) | ||||
| Those who are concerned about someone who may be at risk of suicide | Training on suicide awareness and responding to signs for suicide in others delivered in a variety of settings where staff encounter those who are risk (including staff in job centres, police and emergency departments) | Employment services
Police A&E/secondary care providers Social Care Primary care |
Induction and ongoing training of front line staff | ||
| Provide information to family, carers and friends of people being care for by mental health services on how to contact services at all times including when in crisis | SWLSTG NHS Trust | Crisis Services /Crisis line | |||
| Promote the Samaritans’ Facebook page
https://www.facebook.com/samaritanscharity |
All services | ||||
6 Priorities
Four areas are proposed as priorities – highlighting their potential contribution to preventing and reducing suicide and self-harm.
These priorities focus on:
- Monitoring the impact of certain current activities to ensure that they are effectively delivered – particularly with respect to reducing risk among those in distress and crisis who are presenting to services.
- Current services-or planned- that are under-developed –that are particularly important in reaching high risk groups and promoting mental wellbeing, and also providing early intervention.
Lead agencies/functions are identified. The evidence indicates that there are costs of not ensuring these particular areas are addressed- for those groups at high risk of committing suicide and self-harming.
6.1. Access to treatment for depression for high risk groups
Ensure early detection and treatment of depression among high risk groups including young and middle aged men, and people with long term physical conditions.
- Increase access to psychological therapies and recovery rates among high risk groups (lead: CCG/RWS/MIND)
- Ensure information about depression and services is available in ‘male settings’ (such as pubs and sports/recreation venues) (lead: RWS/MIND, community groups)
6.2. Promotion of mental wellbeing at work
Encourage workplace policies that promote the mental wellbeing of employees in line with NICE guidance.
- Richmond Council’s adoption of the London Healthy Workplace Charter includes the promotion of mental wellbeing across a range of workplace policies and effective management practices for example, stress management and access to wellbeing support via the Employee Assistance Programme (EAP). Relevant policies include:
- Equality and Diversity
- Flexible Working
- Dignity at Work
- Code of Practice on Challenging Bullying and Harassment (lead: Public Health/HR)
- In Richmond Council’s phase 2 plan of the Charter, it will work as an exemplar to support local employers to adopt the Charter and work towards meeting all of the standards, including mental health and wellbeing. (Lead: Public Health/CCG).
6.3. Access to crisis intervention services for people with mental health and substance misuse problems (including dual diagnosis), together with ongoing recovery support services
- Strengthen crisis services including outreach (with agreed protocols and referral pathways) to ensure rapid access to specialist assessment and appropriate support for people with mental health and/or substance misuse in periods of distress and crisis (lead: NHS and PH commissioners, mental health trust and Richmond Integrated Recovery Service (RIRS))
- Improve and monitor the psychiatric liaison services in A&E in acute hospitals for people self-harming/attempting suicide (lead: NHS commissioners, mental health trust, acute providers)
- Develop alcohol liaison pathway/service in A&E acute hospitals, linked to the psychiatric liaison service (lead: RIRS, NHS and PH commissioners, mental health trust, acute trusts)
6.4. Prevention of self-harm among young people
- Ensure support is available for young people who are at risk of/ or self-harming- in line with agreed local self-harm pathway (lead: CCG commissioners/AfC/ CAMHS (emotional wellbeing service and mental health trust) and acute trusts) and specifically
- Ensure young people self-harming and presenting at A&E have access to psychological assessment and therapies and follow up support
References
7 References
[1] NICE, 2011, Self-harm: longer-term management, https://www.nice.org.uk/guidance/CG133/chapter/introduction
[2] WHO, https://www.who.int/topics/suicide/en/
[3] One survey found only 12.6% of self-harm episodes in 15-16 year-olds resulted in presentation to hospital:
Hawton, K., Rodham, K., Evans, E., & Weatherall, R. (2002). Deliberate self-harm in adolescents: self report survey in schools in England. Bmj, 325(7374), 1207-1211.
[4] Gov.uk, https://www.gov.uk/after-a-death/when-a-death-is-reported-to-a-coroner
[5] Inquest, https://www.inquest.org.uk/help/handbook/section-4-3-verdicts
[6] Office for National Statistics, Suicides in the United Kingdom, 2012 Registrations. https://www.ons.gov.uk/ons/dcp171778_351100.pdf
[7] NICE, 2004, CG16 Self-harm: full guideline https://www.nice.org.uk/guidance/cg16/evidence
[8] WHO, 2012, Public health action for the prevention of suicide: a framework https://apps.who.int/iris/bitstream/10665/75166/1/9789241503570_eng.pdf
[9] E.g. Health and Social Care Information Centre, Hospital statistics on teenagers: girls predominate in self-harm cases, boys in assaults, October 1, 2013, https://www.hscic.gov.uk/article/3579/Hospital-statistics-on-teenagers-girls-predominate-in-self-harm-cases-boys-in-assaults.
[10] Office for National Statistics, Suicides in the UK, 2011, https://www.ons.gov.uk/ons/rel/subnational-health4/suicides-in-the-united-kingdom/2011/stb-suicide-bulletin.html#tab-Coding-changes
[11] Public Health England, Health Profiles 2014, https://fingertips.phe.org.uk/profile/health-profiles
[12] Public Health England, Children and Young People’s Health Benchmarking Tool, https://fingertips.phe.org.uk/profile/cyphof, (accessed 1st December 2014).
[13] Office for National Statistics, Annual Mid-year Population Estimates, 2013
[14] This tallies well with the official figures published by HSCIC, which has 92 deaths due to intentional self-harm or poisoning/injury of undetermined intent in the same period (HSCIC Dataset: Mortality from suicide and injury undetermined: directly standardised rate, 15+ years, annual trend, MFP). It is also not far from the number of cases of suicide identified through the audit of the coroner’s files (in section 4.5), although due to delays in registration these are not strictly identical cohorts.
[15] Public Health England, Public Health Outcomes Framework, 4.10 – Suicide rate (persons), https://www.phoutcomes.info, (accessed 10th February 2015).
[16] Department of Health, 2014, Statistical update on suicide, https://www.gov.uk/government/uploads/system/uploads/attachment_data/file/278120/Suicide_update_Jan_2014_FINAL_revised.pdf.
[17] Public Health England, Suicide Prevention Profiles, Male suicide crude rate: per 100,000 males (5 year average), https://fingertips.phe.org.uk/profile-group/mental-health/profile/suicide, (accessed 30th March 2015).
[18] Office for National Statistics, 2013 mortality statistics, https://www.ons.gov.uk/ons/rel/vsob1/mortality-statistics–deaths-registered-in-england-and-wales–series-dr-/2013/index.html.
[19] Office for National Statistics, 2011 Census.
[20] NICE, Promoting mental wellbeing at work, https://www.nice.org.uk/guidance/Ph32
[21] NICE, https://pathways.nice.org.uk/pathways/service-user-experience-in-adult-mental-health-services
[22] NICE, https://pathways.nice.org.uk/pathways/self-harm
[23] NICE, https://www.nice.org.uk/Guidance/CG123 Common mental health disorders in primary care
[24] NICE, https://pathways.nice.org.uk/pathways/social-and-emotional-wellbeing-for-children-and-young-people
[25] NICE, https://pathways.nice.org.uk/pathways/depression ; https://pathways.nice.org.uk/pathways/self-harm/self-harm-overview; https://pathways.nice.org.uk/pathways/eating-disorders
8 Appendices
- Pre-screening for Equalities Impact Needs Assessment (EINA)
| Potential impacts on these characteristics have been identified as arising from the topic of this needs assessment | Stakeholder groups | |||
| Equality Act 2010 protected characteristics | Age | ✓ | Suicide more prevalent in 35-54 yr olds; self-harm more prevalent in 15-24 yr olds. | Workshop conducted with stakeholders and mental health strategy and provider groups with representations from users including LGBT |
| Sex | ✓ | Suicide more prevalent in males; self-harm more prevalent in females | ||
| Race | ✓ | Higher proportion of self-harm related hospital attendances and admissions for White British. | ||
| Disability | ✓ | Physical and mental health problems common in suicide cases. | ||
| Religion & Belief | ✓ | Religious beliefs discouraging suicide can be a protective factor. | ||
| Sexual orientation | ✓ | LGB more likely to attempt suicide. | ||
| Gender reassignment | ✓ | Indications that transgender people have higher rates of self-harm. | ||
| Pregnancy and maternity | ✓ | Self-harm more prevalent in single parents. Stressful life events can precipitate an act of self-harm or suicide. | ||
| Marriage and civil partnership | ✓ | Relationship issues, e.g. divorce, can precipitate an act of self-harm or suicide. | ||
Document Information
Published: July 2015
For review: July 2018
Topic lead: Amanda Killoran, Public Health Principal