1 Introduction
1.1. Aim
This needs assessment report sets out the current and future challenges of ensuring that adult residents of Richmond upon Thames live healthy lifestyles.
It also highlights key messages to guide the development and commissioning of services that support healthy living in Richmond effectively.
1.2. Scope
This report focuses on the needs of the general adult population. Consequently it is not intended to consider the particular healthy lifestyle issues faced by other specific groups, such as newborns, infants, children, young people, pregnant women, new mothers, frail older people, and people diagnosed with major illnesses, long-term conditions, and disabilities. These considerations are made in other reports assessing their wider needs.
While this report considers physical activity and healthy eating, which are key lifestyle issues associated with obesity, a related but separate detailed needs assessment report deals with the topic of obesity. Similarly, a needs assessment report on substance misuse supplements this one by considering interventions for people with serious alcohol related problems in more detail.
1.3. Who is this for?
This needs assessment report is intended to inform the policies, strategies, development and commissioning plans, and practice in local organisations including Council teams, NHS organisations such as the Clinical Commissioning Group (CCG) and Trusts, and other organisations, such as the voluntary sector and representatives of the public and patients.
2 Background
2.1. Introduction
Recognition of the impact of healthy lifestyles on health outcomes and the importance of strategies to ensure opportunities to adopt healthy lifestyles, continues to grow.
Indeed analysis by the World Health Organization (WHO) estimates that the majority of the top ten risk factors for early death and disability in the UK (listed below in order of impact), are related to healthy lifestyles [1]:
- Tobacco use
- Harmful alcohol use
- High blood pressure
- High cholesterol
- Overweight and obesity
- Physical inactivity
- Illicit drug use
- Low fruit and vegetable intake
- Occupational health risks
- Poor sexual health
In particular it is estimated that in 2010, 40% of the total disability adjusted life years (DALYs) lost in the UK were due to tobacco, high blood pressure, over-weight and low physical activity [2].
Also, as summarised by the King’s Fund and Local Government Association below, it is important to recognise that individuals may not just experience the health risks of single particular unhealthy behaviours, but that these often occur together to represent a wider unhealthy lifestyle, with greater combined health risks and substantial health impact.
Multiple unhealthy behaviours have a cumulative effect on health. Someone in mid-life who smokes, drinks too much, exercises too little, and eats poorly is four times as likely to die in the next 10 years as someone who does none of these things. 2
Consequently a number of key healthy lifestyle topics have become high priorities for research, policy, strategy and practice. These include:
- Physical activity
- Healthy eating
- Smoking
- Alcohol
This report considers the local needs in relation to these topics for adults in Richmond upon Thames.
It is important to recognise that healthy choices by individuals (e.g. exercise) are mediated or influenced by the wider determinants of health (e.g. planning and availability of open spaces and affordable recreation facilities). Consequently planners and commissioners across a wide range of local services have potentially substantial contributions to improving healthy lifestyles.
2.2. Healthy lifestyles & outcomes
2.3. Physical activity
In order to gain the health benefits of physical activity, current guidelines suggest that adults (i.e. people aged 19-64 years) should attain the equivalent of the following each week:
- At least 150 minutes (2 hours and 30 minutes) of moderate-intensity aerobic activity, such as cycling or fast walking every week, and;
- Muscle-strengthening activities on 2 or more days a week that work all major muscle groups (legs, hips, back, abdomen, chest, shoulders and arms).
Daily chores such as shopping, cooking or housework do not count towards the 150 minutes. This is because the effort needed to do them is not hard enough to get the heart rate up.
Older adults, aged 65 years or older, who are generally fit and have no health conditions that limit their mobility, should try to be active daily and attain the same activity targets as adults. In addition, older people at risk of falls, such as people with weak legs, poor balance and some medical conditions, should do exercises to improve balance and co-ordination (e.g. yoga, tai chi, dancing) on at least two days a week.
Research shows that people who exercise regularly gain the following health outcome benefits:
- Up to a 35% lower risk of coronary heart disease and stroke
- Up to a 50% lower risk of type 2 diabetes
- Up to a 50% lower risk of colon cancer
- Up to a 20% lower risk of breast cancer
- A 30% lower risk of early death
- Up to an 83% lower risk of osteoarthritis
- Up to a 68% lower risk of hip fracture
- A 30% lower risk of falls (among older adults)
- Up to a 30% lower risk of depression
- Up to a 30% lower risk of dementia
Other studies also show that exercise improves other aspects of health-related quality of life and wellbeing, including stress, sleep quality, mood, and self-esteem.
In addition, a growing evidence-base suggests that general physical inactivity or a sedentary lifestyle can also contribute additionally to these health risks, even where general activity targets are achieved. Consequently maintaining activity throughout the day, to avoid long periods of sitting or lying down is also important, particularly amongst older people who may engage less in moderate or vigorous exercise.
From an economic point of view it is estimated that a 1% reduction in inactivity levels results in savings equivalent to £44 per household [4]
2.4. Healthy eating
Healthy eating in adults is multifaceted, though current emphasis is often focussed on its contribution to healthy weight and avoiding obesity.
People who are overweight have a higher risk of type 2 diabetes, heart disease and certain cancers. Excess weight can also make it more difficult for people to find and keep work, and it can affect self-esteem and mental health. Health problems associated with being overweight or obese cost the NHS more than £5 billion every year [5].
In addition, as summarised below un-healthy eating is also associated with a range of other health problems.
Table 1. Key diet & health risks
|
Un-healthy eating/diet |
Health impact |
|
High salt |
High blood pressure Stroke |
|
High sugar |
Dental health |
|
Low fibre |
Colorectal cancer |
|
Vitamin D |
Bone health (e.g. rickets) |
|
Iron deficiency (women) |
Anaemia |
2.5. Smoking
Smoking is the largest overall cause of preventable illness and premature death in the UK; and is responsible for more premature deaths than the six other most common causes (i.e. drug misuse, road accidents, other accidents & falls, preventable diabetes, suicide, alcohol abuse) combined.
The following shares of important causes of death can be attributed to smoking:
- 35% respiratory diseases
- 29% all cancers
- 14% circulatory diseases
- 6% diseases of the digestive system
Around half of regular smokers are killed by a smoking related disease, and on average lose 16 years of life.
In addition, smoking also increases the risks of other health problems, including erectile dysfunction, dental problems, infertility, and low birth weight.
It is also important to recognise that smoking affects the health of non-smokers due to passive smoking, and that smoking is a major contributor to geographic and socioeconomic health inequalities.
Among smokers, around two-thirds would like to quit, and three-quarters have attempted to quit.
From an economic point of view estimates suggest that stop smoking interventions represent a good return on investment. For instance, school-based smoking prevention programmes can deliver £15 savings for every £1 invested [7].
2.6. Alcohol
Alcohol misuse encompasses a range of problem behaviours related to the frequency and level of alcohol consumption. The risk categories and impacts of alcohol misuse are summarized in the following sections.
Table 2. Alcohol consumption & risk
|
Drinking category |
Units [8] per day on a regular basis |
|
|
|
Men |
Women |
|
Lower-risk/sensible/responsible |
< 3 – 4 |
< 2 – 3 |
|
Increasing-risk |
> 3 – 4 |
> 2 – 3 |
|
Higher-risk |
> 8 (60 per week) |
> 6 (35 per week) |
Guidelines recommend that men should not regularly drink more than 3-4 units of alcohol a day, and women should not regularly drink more than 2-3 units a day.
‘Regularly’ means drinking this amount every day or most days of the week.
It’s also recommended that both men and women should have at least two alcohol-free days each week.
The short-term health impacts of alcohol misuse include:
- Alcohol poisoning/coma
- Accidents & injury
- Violence & antisocial behaviour
- Unsafe sex
- Loss of possessions
- Hangovers
- Unplanned time away from employment or education
Long-term health impacts include:
|
· High blood pressure |
· Bowel cancer |
|
· Stroke |
· Depression |
|
· Pancreatitis |
· Dementia |
|
· Liver disease |
· Sexual dysfunction |
|
· Mouth cancer |
· Infertility |
|
· Head & neck cancer |
· Immunity problems |
|
· Breast cancer |
· Alcohol dependence |
In addition, to the significant health impacts, alcohol misuse can also have long-term social and personal implications. These potentially include:
- Family break-up and divorce
- Domestic abuse
- Unemployment
- Homelessness
- Financial problems
From an economic point of view estimates suggest that alcohol interventions can represent a good return on investment. For instance, every £1 invested in motivational interviewing and developing supportive networks for people with alcohol or drug addiction problems, returns £5 savings to the health care, social care, and criminal justice services [7].
2.7. National policy context
2.8. Public Health Outcomes Framework
As a reflection of the importance of these topics a number of indicators for healthy lifestyle behaviour, services, and outcomes have been included in the Public Health Outcomes Framework (PHOF) for England.[9]
Table 3. Health Lifestyle Public Health Outcomes Framework (PHOF) Indicators
|
Indicator reference |
Topic |
|
PHOF1.16 |
People using outdoor space for exercise/health reasons |
|
PHOF2.03 |
Smoking in pregnancy |
|
PHOF2.12 |
Obese or overweight adults |
|
PHOF2.13i |
Physically active adults (i.e. Doing at least 150 “equivalent” minutes of at least moderate intensity physical activity per week in bouts of 10 minutes or more in the previous 28 days) |
|
PHOF2.13ii |
Physically inactive adults (i.e. Doing less than 30 “equivalent” minutes of at least moderate intensity physical activity per week in bouts of 10 minutes or more in the previous 28 days) |
|
PHOF2.14 |
Smoking prevalence – adults |
|
PHOF2.14 |
Smoking prevalence – adults with routine/manual occupation |
|
PHOF2.18 |
Alcohol-related admissions |
|
PHOF2.2iii |
NHS health checks offered |
|
PHOF2.2iii |
NHS health checks take-up |
|
PHOF2.2iii |
NHS health checks received |
|
PHOF4.06i |
Premature (<75 yrs) mortality rate from liver disease |
|
PHOF4.06ii |
Premature (<75 yrs) mortality rate from preventable liver disease |
|
PHOF4.07i |
Premature (<75 yrs) mortality rate from respiratory disease |
|
PHOF4.07ii |
Premature (<75 yrs) mortality rate from preventable respiratory disease |
Also, to support progress on these areas, a number of national strategies have been developed and evidence-based national guidance documents published. These are summarised below according to the lifestyle topic.
2.9. Physical activity
NICE have published a briefing on strategies and interventions to increase physical activity for local authorities and their partners[10], and Public Health England have recently published a national physical activity strategy[11], and a guide on local interventions to tackle physical inactivity[12]
2.10. Healthy eating
Healthy eating is a broad topic, with frequently changing evidence and advice. Current policy in England gives greatest attention to improving healthy eating to tackle increasing levels of obesity, with the aim of achieving a daily national consumption reduction of 5 billion calories [13].
The following elements make-up two key areas of action on the policy [5] .
Helping people make healthier choices:
- Advice on healthy diet (fruit & vegetables: 5-A-Day) & physical activity (Change4Life Programme).
- Improvements in food labelling.
- Encouraging businesses to include calorie information on menus.
- Guidance on healthy levels physical activity.
Encouraging responsible business (Public Health Responsibility Deal):
- Reducing ingredients (e.g. salt & fat) that can be harmful if people eat too much of them.
- Encouraging people to eat more fruit & vegetable to reach their 5 A Day.
- Putting calorie information on menus.
- Helping people eat fewer calories (e.g. changing portion size or product recipe).
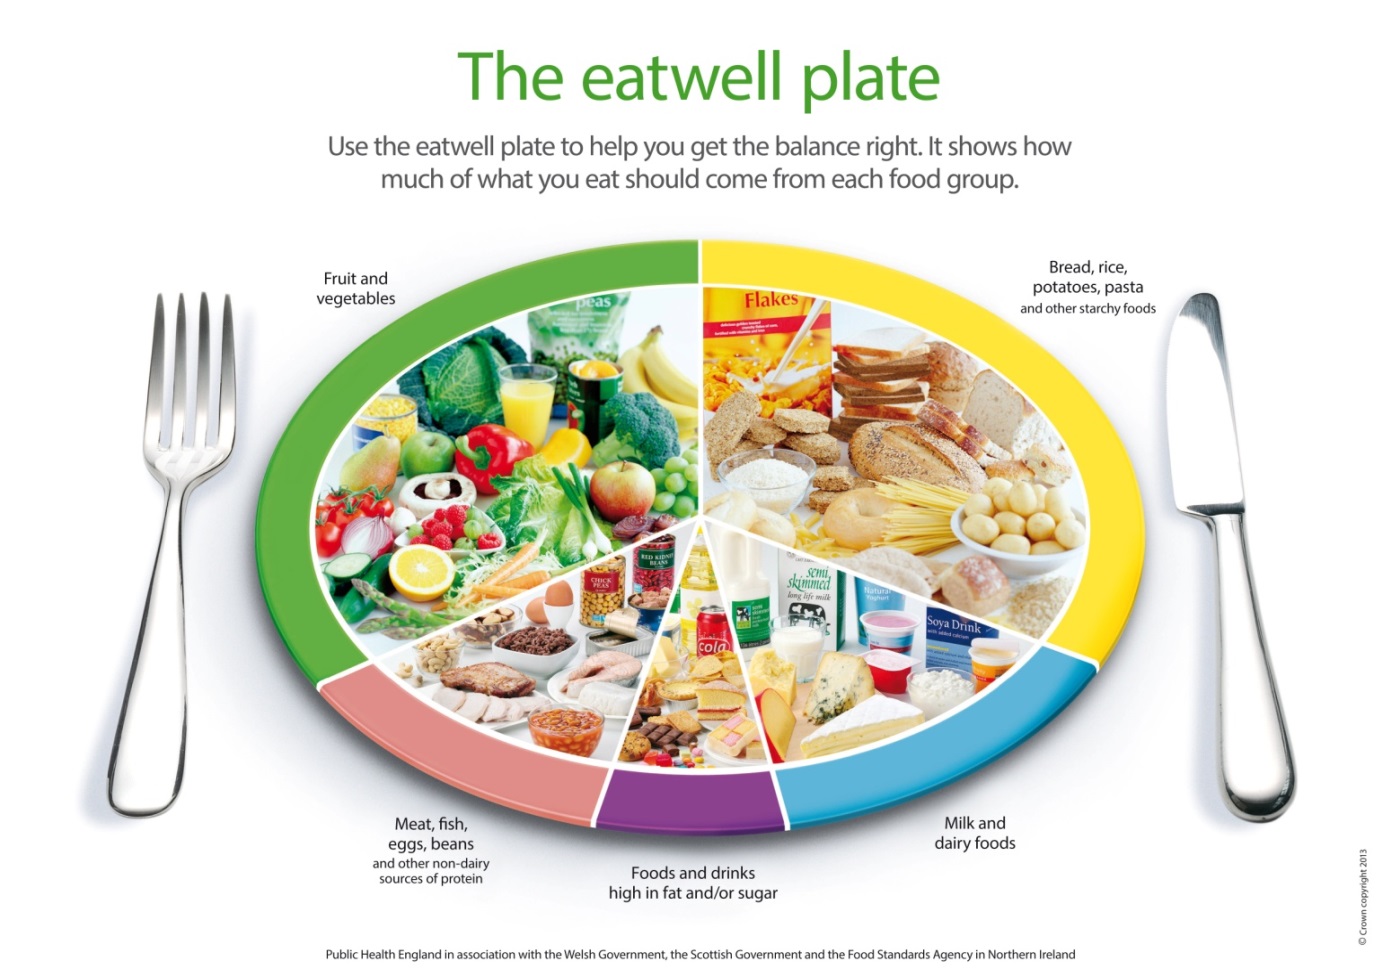
Overall, advice to adults in England on healthy eating covers the following key messages:
- Balanced diet.
- Limits to fat, salt [14] & sugar [15] intake.
- Consumption of fruit & vegetables.
- Calorie intake consistent with levels of activity to maintain healthy weight.
In addition to the other policies and initiatives mentioned above, the Public Health England Eatwell Plate guidance [16], shown below, incorporates many of these messages through a simple description of the healthy diet balance from major food groups.
2.11. Smoking
Restrictions on smoking in public places were introduced in 2007. Subsequently in England a tobacco control plan has shaped national and local action 6. In addition, NICE have published a briefing on strategies and interventions to tackle smoking for local authorities and their partners [17], and Public Health England has recently launched a set of support tools for local tobacco control[18].
2.12. Alcohol
The UK national alcohol strategy was published in 2012 [19], and NICE have published a briefing on strategies and interventions to tackle alcohol related health issues for local authorities and their partners [20].
Key areas for action include:
- Education & advice on alcohol risks.
- Licensing & enforcement.
- Alcohol pricing.
- Screening for alcohol risk levels & brief interventions.
2.13. Behaviour change
In addition to guidance on particular aspects of healthy lifestyles, NICE have also published briefings for local authorities and their partners on:
- Behaviour change [21].
- Encouraging people to have NHS Health Checks & supporting them to reduce risk factors [22].
3 Local Picture
The following sub-sections describe the scale, severity, and service impact/cost and economic burden of unhealthy lifestyles in Richmond.
3.1. Physical activity
Behaviour in Richmond
As shown in the Figure below, at 66%, a high proportion of adults in Richmond are physically active to recommended levels, compared with 56% in London and England; and as a result Richmond rates as in the best quarter of English local authorities for this PHOF indicator.
Figure 1. Percentage of residents physically active[23] in SW London Boroughs, London and England 2013
 Source: PHOF Indicator 2.13i. Based on a local sample of the Active People Survey (Sport England) 2013, aged 16 years +
Also, consistent with levels of physical activity, as shown below, at 16%, Richmond adults have the lowest percentage of physical inactivity among local authorities in England.
Figure 2. Percentage of residents physically inactive[24] in SW London Boroughs, London and England 2013 Source: PHOF Indicator 2.13ii. Based on a local sample of the Active People Survey (Sport England) 2013, aged 16 years +
Despite these favourable overall ratings, substantial potential improvements remain to be attained in Richmond for the following reasons:
- Almost half of adults (approximately 65,000) are estimated to be obese or overweight.
- One in six adults (approximately 25,000) are estimated to do less than 30 minutes of physical activity a week.
Health outcomes in Richmond
Along with healthy calorie intake, good levels of physical activity help prevent obesity.
Information on local levels of obesity is available from the following sources:
- Estimates based on a local sample of the national Active People Survey (2012)/Public Health Outcomes Framework (PHOF).
- Estimates based on modelling in the NICE Obesity Costing Tool (2010).
- Measurement of weight in adult GP patients as part of the Quality & Outcomes Framework [QOF] (2013/14).
The findings according to these measures are show in the figures and tables below.
Figure 3. Percentage of adults estimated to be overweight or obese, 2012: SW London Boroughs, London & England
 Source: PHOF Indicator 2.12. Based on a local sample of the Active People Survey (Sport England) 2012, aged 16 years +, based on self-reported height & weights, adjusted for reporting bias.
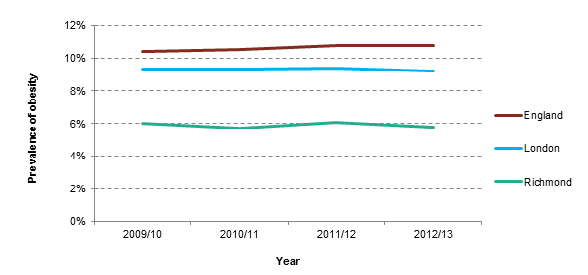
Figure 4. GP observed obesity prevalence, 2013/14, Richmond, London & England
Source: QOF 2013/14, HSCIC
Table 4. Estimated number and population prevalence of overweight & obesity, and excess weight in Richmond upon Thames
|
|
Overweight BMI 25-30 |
Obese BMI >30 |
Overweight & obese BMI > 25 |
|||
|
N |
% |
N |
% |
N |
% |
|
|
Males |
23,517 |
33.1% |
11487 |
16.2% |
35,004 |
49.3% |
|
Females |
19,017 |
25.1% |
11296 |
14.8% |
30,313 |
39.9% |
|
Total |
42,534 |
29.0% |
22,783 |
15.5% |
65,317 |
44.5% |
Source: NICE Obesity costing tool (2010)
The findings of the Active People Survey (47.6%) and the NICE model (44.5%), which seek to estimate population-wide obesity and overweight in adults, are roughly consistent. However, QOF data, reporting obesity alone, in patients measured by GPs (4.6%), reports a substantially lower level compared to the NICE model (15%).
As shown in the table below, the total estimated local annual costs of overweight and obesity borne by the NHS in Richmond has increased substantially from £42 million to £47 million between 2007 and 2015.
Table 5. Estimated annual NHS cost of overweight & obesity in Richmond, 2007 – 2015
|
|
Annual NHS Costs |
||
|
2007 |
2010 |
2015 |
|
|
Overweight and obesity |
£42.4m |
£44m |
£47.1m |
|
Obesity |
£22m |
£23.8m |
£27.4m |
Source: Healthy Weight, Healthy Lives: A Toolkit for Developing Local Strategies, 2008
As shown below, the annual local health care costs of the levels of physical activity seen in Richmond are estimated to total £1.3 million, and are attributed to treating the burden of disease of a wide range of conditions.
Table 6. Estimated disease specific annual health care costs associated with limited physical activity in Richmond
|
Disease |
Annual health care cost (£) |
|
Diabetes |
£481,050 |
|
Breast cancer |
£308,880 |
|
Coronary heart disease |
£232,530 |
|
Cerebrovascular disease |
£198,720 |
|
Lower gastrointestinal cancer |
£102,080 |
|
Total |
£1,323,260 |
Source: Sport England/British Heart Foundation Health Promotion Research Group, Oxford University https://archive.sportengland.org/support__advice/local_government/local_sport_profile_tool/costs_of_physical_inactivity.aspx
3.2. Healthy eating
Behaviour in Richmond
Officially validated information on local healthy eating is limited to estimates of daily fruit and vegetable consumption.
As shown in the figure below, Richmond is estimated to achieve significantly higher levels of fruit and vegetable consumption than in England as a whole, with 43% of residents achieving this standard.
Figure 5. Percentage of adults estimated to eat at least 5 portions of fruit and vegetables a day, 2006-2008: SW London, London & England
 Source: 2013 District Health Profile https://www.apho.org.uk Modelled estimate based on the Health Survey for England
Given the limited information available on local patterns of healthy eating, it is helpful to reflect on Richmond’s likely patterns based on the findings of national research, showing that people in general fail to attain standards in terms of sugar, saturated fat, salt, fruit and vegetables, oily fish, vitamin D, and iron [25].
Health outcomes in Richmond
Along with healthy levels of physical activity as mentioned above, various aspects of health eating, including calorie intake and sugar consumption help avoid obesity.
Health outcomes for obesity were reported earlier and are not repeated here.
3.3. Smoking
Behaviour in Richmond
As shown in the Figure below, at 11.4%, Richmond has a relatively low estimated population prevalence of smoking in adults, compared with 17.3% in London and 18.4% in England; and as a result Richmond is in the best quartile of English local authorities for this PHOF indicator.
Figure 6. Estimated smoking prevalence in SW London Boroughs, London & England, 2013
 Source: PHOF Indicator: 2.14. Tobacco profile www.tobaccoprofiles.info Smoking prevalence in adults, based on a local sample from the Integrated Household Survey (Department of Health).
Health outcomes in Richmond
Despite this favourable overall picture regards smoking prevalence, smoking remains a major concern in Richmond for the following reasons:
- The higher prevalence of smoking among more disadvantaged groups (i.e. in routine and manual occupations) in Richmond (17%).
- Approximately 17,000 adults in Richmond continue to smoke.
- It is estimated that in Richmond over 200 deaths & 1,000 hospital admissions per year are related to smoking.
Figure 7. Death rate attributable to smoking (35 years and over; all causes and from heart disease and stroke) per 100,000 population in SW London Boroughs, London and England, 2011-2013
Source: Tobacco profile www.tobaccoprofiles.info based on data from the Office for National Statistics (ONS)
As shown below, the overall annual local economic burden of smoking in Richmond is substantial (£43.2 million) and affects many elements of the economy.
Figure 8. Estimated total cost of smoking in Richmond’s economy
 Source: Ash. 2014. Cost of smoking toolkit. https://www.ash.org.uk/localtoolkit/R7-LDN.html
3.4. Alcohol
Behaviour in Richmond
As shown in the figure below, estimates show that levels of ‘increasing’ and ‘higher’ risk drinking are possibly slightly higher in Richmond than in other SW London Boroughs, London and England as a whole.
Figure 9. Estimated percentage of residents aged 16 years and over who drink a low, increasing or high risk number of units per week, 2009 [26].
Source: Local alcohol profile, www.lape.org.uk Modelled estimate from national surveys, aged 16 years and over, 2009
While this difference is small, it remains important to recognise that substantial numbers of adults are at risk of alcohol related disease and other problems.
The numbers of Richmond residents drinking at levels harmful to health remain high. About 28,000 people in Richmond borough are estimated to consume alcohol at levels of ‘increasing risk’ to their health, and around 10,000 are estimated to be higher risk drinkers [27]. Richmond has higher than average proportions of increasing-risk (21.3%) and higher-risk (7.8%) drinkers, compared to England. Richmond ranks 316 out of 326 local authorities for this ‘higher risk’ drinking. Conversely, Richmond has a below average proportion of over-16s who are abstainers (15.0%, second lowest in London) and lower-risk drinkers (70.1%, third lowest in England) [28].
Health outcomes in Richmond
As shown in the figures below, the pattern of drinking identified above is consistent with the information shown below, with death rates higher among Richmond residents, compared to other SW London Boroughs and London as a whole.
This also shows that alcohol-related deaths are around twice as common in men compared to women.
Figure 10. Directly age standardised alcohol-specific mortality rate, in SW London Boroughs, London and England, 2010-12: Males
Source: Local alcohol profile, www.lape.org.uk, based on annual death extracts from the Office for National Statistics
Figure 11. Directly age standardised alcohol-specific mortality rate, in SW London Boroughs, London and England, 2010-12: Females
Source: Local alcohol profile, www.lape.org.uk, based on annual death extracts from the Office for National Statistics
Despite this, rates of alcohol-related hospital admissions among Richmond residents are lower than other SW London Boroughs, London and England.
However, the number of alcohol related hospital admissions among Richmond residents remains substantial. In 2012/13 there were 1,007 admissions in men and 562 in women.
4 Local Services & strategies
4.1. Introduction
This chapter summarises both the wider local strategies seeking to enable people to live healthy lifestyles, and the nature and delivery of specific services which support people in adopting healthy lifestyles.
4.2. Strategies
This year the Council published the London Borough of Richmond upon Thames and Richmond Clinical Commissioning Group (CCG) Prevention Strategy Framework 2015 – 2018, setting the context for the attainment of healthy lifestyles amongst Richmond residents and people registered with Richmond GPs [29].
The strategy’s stated vision is that:
People in Richmond are empowered to take responsibility for their own health and wellbeing in a safe and supportive environment, achieve their full potential and live their lives with confidence and resilience.
Overall, the strategy seeks to prevent long term conditions and the lifestyle choices that contribute to their development, including over-weight and obesity, smoking, harmful drinking, and physical inactivity. Ultimately also intending to reduce need for health care services, and delay the need for social care.
Also, the strategy includes the specific aim to:
Enable people to have access to high-quality information and lifestyle interventions that prevent their health and care needs becoming serious.
And, related priorities to:
- Priority 2: Create healthy communities – harnessing local community assets to support people and their carers.
- Priority 3: Re-shape healthy lifestyles services and embedding self-care.
Progress in achieving the vision and objectives will be overseen by the Borough Health and Wellbeing Board.
Overall, the strategy recognises that making progress will entail comprehensive action to encourage individuals in making healthy lifestyle choices, and developing a local context and environment that enables this. Consequently strategies in the following areas are recognised as necessary:
- A whole Richmond approach – encompassing contributions across council responsibilities, including legislation, housing, employment, transport infrastructure, recreational areas and community safety.
- Skilling-up the wider workforce to Make Every Contact Count.
- Creating Healthy workplaces.
- Housing.
- Leisure, culture & sport.
- Parks & open spaces.
- Employment.
- Transport.
- Empowering communities (e.g. volunteering, Village Plans).
- Re-shaping healthy lifestyle services.
- Embedding self-care.
In order to progress the strategy, a Health and Wellbeing Board Listening Event focussing on Healthy Lifestyles was held in March to engage with a wide range of local stakeholders community representatives. Feedback can be found here: https://cabnet.richmond.gov.uk/documents/s57288/07a%20HWB%20Strategy%20Refresh%2020150609.pdf
4.3. Services
A detailed commissioning plan has been developed to implement key aspects of the Richmond Prevention Strategy Framework 2015-2018. This includes the following services of relevance to healthy lifestyles, which are directly commissioned by the Public Health Department:
- NHS Health Checks
- Stop Smoking
- Lifestyle services (LiveWell [2013-15] & Lifestyle Hub [2015 onwards]
In future, it is intended that the services focus as closely as possible on:
- Preventing long term conditions.
- Linkages between preventive services.
- Primary prevention.
- Engagement with people at high risk.
Also, it is planned to increase the capacity and effectiveness of weight management services, and make improvements in the exercise referral scheme.
The new model of Lifestyle Prevention Services is shown in the figure below.
4.4. NHS Health Checks
Service model & interventions [30]
NHS Health Checks aims to prevent vascular diseases including heart disease, diabetes, kidney disease, stroke, and dementia; by detecting early risks in adults aged 40 – 74 years (without existing diagnoses of these conditions), and providing appropriate lifestyle advice and apps, or referral to local preventive or treatment services via the new Lifestyle Hub. It can be referred to as a mid-life MOT.
NHS Health Check programme is a Mandatory Council Service, commissioned by the Public Health Department. The Checks are provided by local GPs, community pharmacies, and an outreach service; and considers the following information to assess individual risk or identify signs of possible disease:
- Personal history information: age, ethnicity, & family history of diseases.
- Lifestyle: smoking, exercise & alcohol consumption.
- Cholesterol blood test.
- Blood pressure measurement.
- Height & weight (body mass index [BMI]).
- Blood sugar test (if needed).
Performance
In Richmond, around 46,000 people are eligible for Health Checks, with national targets requiring 20% of these to be invited for appointments annual, as part of a five year rolling programme. The uptake target is 50 – 75%.
Routine performance of the programme is monitored electronically by the Public Health Department. Key performance data is shown in the Table below.
Table 7: Richmond NHS Health Checks performance: 2013/14 & 2014/15
|
NHS Health Checks |
2013/14 |
2014/15 |
||
|
N |
% |
N |
% |
|
|
Offered* |
11781 |
11456 |
||
|
Uptake |
5211 |
44% |
6018 |
53% |
*Annual target = 9200
In 2015/16 a local uptake target of 6750 health checks has been set (i.e. inviting 20% of the annual eligible cohort & an uptake of 75%).
In addition, an internal evaluation of the Richmond Health Check programme was undertaken in 2014 [31]. In summary, this concluded that the programme is effectively managed, represents good value for money, attains high performance levels, & receives high levels of user satisfaction.
However, it was recognised that further improvements in performance, engagement, outreach service delivery, communication and marketing could be achieved by addressing specific identified gaps and challenges. These included:
- Review of outreach service capacity & consideration of alternative providers.
- Exploring additional outreach settings (e.g. workplaces).
- Review of the community pharmacy element of the programme.
- Continued efforts to further increase uptake performance, including in high priority groups (e.g. high CVD risk, carers, people with learning disabilities & severe mental illness).
- Improvements in referral pathways from Richmond’s healthy lifestyle services.
- Exploration of additional wider marketing methods.
In addition, the programme has been acknowledged nationally and internationally due to its IT solutions, innovative systems and processes to tackle health inequalities. Richmond was invited to present the programme at the “Share, Listen and Act NHS Health Checks Annual Conference 2014”. The Richmond’s case study was showcased by the NHS Improving Quality (NHSIQ) at the conference. A Japanese delegation requested and visited Richmond to understand the systems and processes employed by Richmond to tackle health inequalities.
4.5. Stop Smoking
Local Stop Smoking services are jointly commissioned by Richmond and Kingston Councils and core services are provided by Kickit (Thrive Tribe). Smoking cessation services are also offered by GP surgeries, community pharmacies, and a mobile outreach vehicle through Kick It.
The following table provides a summary of 4 week quitters and targets for the Borough of Richmond from 2011/12 to 2013/14. The services have previously met the 4 week quit targets for Richmond. End of year validated figures for (2014/15) smoking quitters are reported in June and published nationally, in September.
Table 8: Richmond Stop Smoking Service performance: 2011/12 – 2014/15
|
Richmond Stop Smoking Service Performance |
2011/12 |
2012/13 |
2013/14 |
2014/15 |
|
Target |
621 |
596 |
610 |
625 |
|
Actual |
622 |
646 |
624 |
261 |
Performance of stop smoking 4 week quitters appears to have fallen significantly during 2014/15, and based on Q1-Q3 it is unlikely that the annual quitter target will be met for 2014/15. The decline in smokers accessing services is a trend seen elsewhere in London and nationally, though the decline appears substantial in Richmond. The Council is currently reviewing the model of provision for stop smoking support locally, in order to fit and work closely alongside the new lifestyles services hub, which will focus on outreach and referral within community settings and through identification and referral of smokers via NHS Health Checks.
4.6. Livewell
Service model
The Richmond LiveWell [32] service was delivered by Hounslow and Richmond Community Health Services (HRCH) and a number of sub-contracted providers between 2013 and 2015.
The service supported adults to set realistic healthy lifestyle goals, supported by healthy lifestyle information, one to one health trainer appointments, telephone support, and a smart phone app.
Building on evaluation and learning from the LiveWell service, from 2015/16 a new model of lifestyle service, Richmond Livewell, Staywell is commissioned from October 2015. Its aims and model of operation are summarised below.
‘The aim of Livewell Staywell is to promote, facilitate and motivate behaviour change that will lead to healthy lifestyle choices and ultimately improve health and wellbeing outcomes and reduce inequalities’.
Interventions & performance
The Richmond Livewell Staywell Hub service will take a pro-active role to reach, identify and target lifestyle referral and support across a range of interventions detailed below (planned annual capacities are detailed in brackets).
The Livewell Staywell Hub will also be responsible for ensuring key health improvement and lifestyles information is marketed and promoted to key groups and individuals in the borough who may be at risk of developing long term conditions.
- Weight management programme [Target: 500 clients]
- Exercise referral [Target: 500 clients]
- Walking away from Diabetes [Target: 200 clients]
- Health Walks [Target: 5,000+ clients]
- NHS Health Checks Outreach Service [Target: 1,500 clients]
4.7. Alcohol
A range of local policies and interventions focussed on reducing risks of alcohol are developed by the public health department. These are underpinned by a joint strategy on substance misuse created by Richmond Council and Clinical Commissioning Group in 2013 [33]. The key elements of action on alcohol are summarised below.
Licensing & enforcement
The Public Health Department undertakes joint work with Council and Metropolitan Police colleagues on local Licensing decisions. Restrictions have been imposed on two premises following reviews of their licenses due to alcohol related incidents. In addition, we are part of the Safe Sociable London Partnership (SSLP) which undertakes work to support local licensing decision-making.
Screening & brief intervention
Local GP practices are commissioned through a locally commissioned service (LCS) contract to deliver Alcohol Identification and Brief Advice (IBA) services for adults, including:
- Screening (AUDIT-C tool).
- Brief intervention in patients drinking at increased risk levels.
- Onward referral of dependent drinkers to local specialist services.
In 2013/14 12,731 patients, representing 8% of adults registered with Richmond GP practices, were screened through the LCS. There is an on-going work with General Practices to improve the uptake and coverage of the service in order to reach the eligible population. Also, practices would be supported in ensuring that information on the service provision is properly recorded on their systems.
In addition, local hospital providers are being encouraged to improve screening among in-patients and A&E attenders.
Specialist treatment services
The Richmond Integrated Recovery Service (RIRS) provides a local specialist comprehensive alcohol treatment service from locations in Richmond and Twickenham. The service includes psychological therapies, pharmacological interventions, community detoxification, and referral to recovery support services (i.e. housing, employment).
There were 438 adults in contact with alcohol treatment service in 2013/14, with 76% (265) starting alcohol treatment; this is an increase from previous year 2012/13 where 195 adults were in treatment and shows slightly higher than the national average of 70%. This is an indication that local treatment services are beginning to attract alcohol clients into treatment.
5 Conclusion
Evidence shows that at least a third of chronic ill health, including dementia, is a result of the four unhealthy behaviours of smoking, poor diet, inactivity and drinking too much alcohol. Despite Richmond’s generally good performance in national comparisons, the absolute numbers of local residents adopting unhealthy behaviours remain high.
While there is evidence of healthier behaviours across some of the common risk factors amongst the Richmond population there are disadvantaged groups within the borough, who may experience bigger barriers to healthy living than those in the more affluent parts of the borough.
Overall, there are substantial numbers of people who take too little exercise, eat unhealthily, are overweight or obese, drink to risky levels, continue to smoke and need access to help and advice to change behaviour. Consequently significant numbers of people are living with long term conditions and this is an increasing trend.
Recognition of the positive impact of healthy lifestyles on health outcomes, and the need for joined up preventative approaches that aim to tackle community and wider environmental factors, as well as individual are essential components of a successful local prevention strategy.
Substantial gains in health and the sustainability of local health and social care services remain to be made through improvements in healthy lifestyles. This is currently being addressed through a series of local commissioning, strategy and policy actions, which aim to put prevention principles and practice at the core.
References
[1] Department of Health. Chief Medical Officer’s Report 2011 https://www.gov.uk/government/uploads/system/uploads/attachment_data/file/141774/CMO_Annual_Report_2011_Chapter_3.pdf
[2] The Kings Fund in partnership with LGA, “Making the case for public health interventions”, 18 September 2014 https://www.kingsfund.org.uk/audio-video/public-health-spending-roi
[3] NHS Choices website https://www.nhs.uk/livewell/Pages/Livewellhub.aspx
[4] UK Active. (2014) Turning the tide of inactivity.
[5] Department of Health (2013) Policy statement: Reducing obesity & improving diet. https://www.gov.uk/government/policies/reducing-obesity-and-improving-diet
[6] Department of Health. Healthy lives, healthy people: a tobacco control plan for England. March 2011. www.gov.uk/government/uploads/system/uploads/attachment_data/file/213757/dh_124960.pdf
[7] King’s Fund & Local Government Association (2014) Making the case for public health interventions. https://www.kingsfund.org.uk/sites/files/kf/media/making-case-public-health-interventions-sep-2014.pdf
[8] A unit of alcohol is 10ml of pure alcohol, which is about half a pint of normal strength lager or a single measure (25ml) of spirits. A small glass (125ml) of wine contains about one-and-a-half units of alcohol.
[9] Public Health Outcomes Framework. www.phoutcomes.info/
[10] NICE. Local government briefing: physical activity. LGB3. July 2012. https://www.nice.org.uk/advice/lgb3
[11] Public Health England. Everybody active, everyday: an evidence-based approach to physical activity. October 2014. www.gov.uk/government/publications/everybody-active-every-day-a-framework-to-embed-physical-activity-into-daily-life
[12] Public Health England. Identifying what works for local physical inactivity interventions. November 2014. www.gov.uk/government/uploads/system/uploads/attachment_data/file/374560/Whatworksv1_2.pdf
[13] Department of Health. October 2011. Healthy lives, healthy people: A call to action on obesity in England. https://www.gov.uk/government/publications/healthy-lives-healthy-people-a-call-to-action-on-obesity-in-england
[14] Public Health England. 2014. High blood pressure: From evidence to action. https://www.gov.uk/government/publications/high-blood-pressure-action-plan
[15] Public Health England. 2014. Sugar reduction: Responding to the challenge. https://www.gov.uk/government/publications/sugar-reduction-responding-to-the-challenge
[16] Public Health England. 2013. The Healthy Plate. https://www.gov.uk/government/uploads/system/uploads/attachment_data/file/340869/2014-250_-_eatwell_plate_Final_version_2014.pdf
[17] NICE. Local government briefing: tobacco. LGB24. January 2015. https://www.nice.org.uk/advice/lgb24
[18] Public Health England. July 2014. www.gov.uk/government/news/enhanced-support-for-local-tobacco-control
[19] Home Office. The government’s alcohol strategy. March 2012. www.gov.uk/government/uploads/system/uploads/attachment_data/file/224075/alcohol-strategy.pdf
[20] NICE. Local government briefing: alcohol. LGB6. January 2012. https://www.nice.org.uk/advice/lgb6
[21] NICE. Local government briefing: behaviour change. LGB7. January 2013. https://www.nice.org.uk/advice/lgb7
[22] NICE. Local government briefing: encouraging people to have NHS Health Checks & supporting them to reduce risk factors. LGB15. February 2014. https://www.nice.org.uk/advice/lgb15
[23] Physically active: at least 150 “equivalent” minutes of at least moderate intensity physical activity per week in bouts of 10 minutes or more in the previous 28 days.
[24] Physically inactive: less than 30 “equivalent” minutes of at least moderate intensity physical activity per week in bouts of 10 minutes or more in the previous 28 days.
[25] Public Health England. 2014. National diet & nutrition survey: 2008 – 2012. https://www.gov.uk/government/news/new-national-diet-and-nutrition-survey-shows-uk-population-is-eating-too-much-sugar-saturated-fat-and-salt
[26] The process assumes that the relationships identified in the national General Lifestyle Survey between alcohol consumption and age, sex and ethnicity are the same at the local authority level; the model-based estimates are unable to take account of any additional local factors that may impact on the true prevalence.
[27] https://www.alcoholconcern.org.uk/for-professionals/alcohol-harm-map/
[28] Public Health England (2014) Local Area Profiles for England.
[29] London Borough of Richmond upon Thames & Richmond CCG. (2015) London Borough of Richmond upon Thames: Promoting wellbeing & independence: An integrated prevention strategy 2015-18.
[30] NHS Choices website. https://www.nhs.uk/Conditions/nhs-health-check/Pages/NHS-Health-Check.aspx
[31] London Borough of Richmond upon Thames. (2014) NHS Health Checks: Service evaluation.
[32] www.livewellrichmond.org.uk
[33] London Borough of Richmond upon Thames/Richmond NHS Clinical Commissioning Group. (2013) Richmond joint strategy for the prevention of substance misuse 2013/16.
Document Information
Published: November 2015
For review: November 2016
Topic lead: Clair Harris, Public Health Principal
Appendices
Appendix 1. Pre-screening for Equalities Impact Needs Assessment (EINA)
To be completed for all needs assessments. This table should signpost the evidence which can be used for subsequent EINAs (at the point of service commissioning and strategy development in relation to the topic of this health needs assessment).
|
|
|
Potential impacts on these characteristics have been identified as arising from the topic of this needs assessment |
Stakeholder groups |
|
||
|
|
|
Relevant stakeholder groups identified |
How have relevant stakeholder groups been involved in this needs assessment? |
|
||
|
|
|
Tick |
Explanation |
|
||
|
Equality Act 2010 protected characteristics |
Age |
✕ |
Focus on adults alone. |
|
|
|
|
Sex |
✓ |
Healthy lifestyle risks, attitudes, & uptake of prevention interventions vary by sex. Men are more likely to drink risky levels of alcohol. |
|
|
|
|
|
Race |
✓ |
Lifestyle preferences vary by race, ethnicity & culture. Particular risks need more detailed assessment. Prevention services need to be appropriately accessible & sensitive. |
|
|
|
|
|
Disability |
✓ |
Disabilities may limit opportunities to adopt healthy lifestyles & engage with mainstream prevention services. |
|
|
|
|
|
Religion & Belief |
✓ |
Prevention services need to be appropriately acceptable to people of different religions & beliefs.. |
|
|
|
|
|
Sexual orientation |
✓ |
Prevention services need to be appropriately acceptable to people of different sexual orientation. |
|
|
|
|
|
Gender reassignment |
✓ |
Prevention services need to be appropriately acceptable to Trans people. |
|
|
|
|
|
Pregnancy and maternity |
✕ |
Not included within scope of report. |
|
|
|
|
|
Marriage and civil partnership |
✓ |
Single men are at higher risk of leading unhealthy lifestyles, especially drinking. |
|
|
|
|
|
Resources: · Richmond health needs assessments on each of the nine protected characteristics of the Equality Act 2010 are available at www.richmond.gov.uk/jsna · Equalities profiles providing Richmond statistics on the nine protected characteristics are available on DataRich https://www.datarich.info/equality-and-diversity |
||||||
A pdf version of this needs assessment can be accessed: Healthy Lifestyle