Borough Level Findings
- Richmond maintains a rank within the 10% least deprived Local Authorities (LAs) in England between 2015 and 2019 and remains the least deprived London borough.
- Richmond ranks amongst the least deprived third of LAs in England for five of seven deprivation domains (Barriers to Housing & Services; Education, Skills & Training; Employment; Health Deprivation & Disability; Income) (Figure 1).
- The borough is the least deprived in England for Education, Skills and Training.

Figure 1. Richmond rank against other local authorities in England for IMD, deprivation domains and supplementary measures (2015 and 2019). Dashed line indicates where borough falls within 50% most or 50% least deprived local authorities.
- In London, Richmond is within the 50% least deprived boroughs across all Indices of Deprivation and is the least deprived borough within the Education, Skills & Training, Employment, Health Deprivation & Disability and Barriers to Housing & Services domains (Figure 2).
- In line with many other London boroughs, Richmond’s Living Environment and Crime domain rankings were amongst its most deprived.
- Between 2015 and 2019, Richmond was ranked as relatively more deprived in London for the Crime domain.

Figure 2 Richmond rank against other local authorities in London for IMD, deprivation domains and supplementary measures (2015 and 2019). Dashed line indicates where borough falls within 50% most or 50% least deprived local authorities.
Borough Dashboard
LSOA Level Findings
- Similarly to 2015, no Richmond LSOAs were ranked amongst the 10% most deprived in England on the Index of Multiple Deprivation (IMD).
- Between 2015 and 2019, a third of Richmond LSOAs were ranked as relatively less deprived (moving up IMD deciles), meaning that almost 90% of LSOAs in Richmond fall within the 50% least deprived nationally.
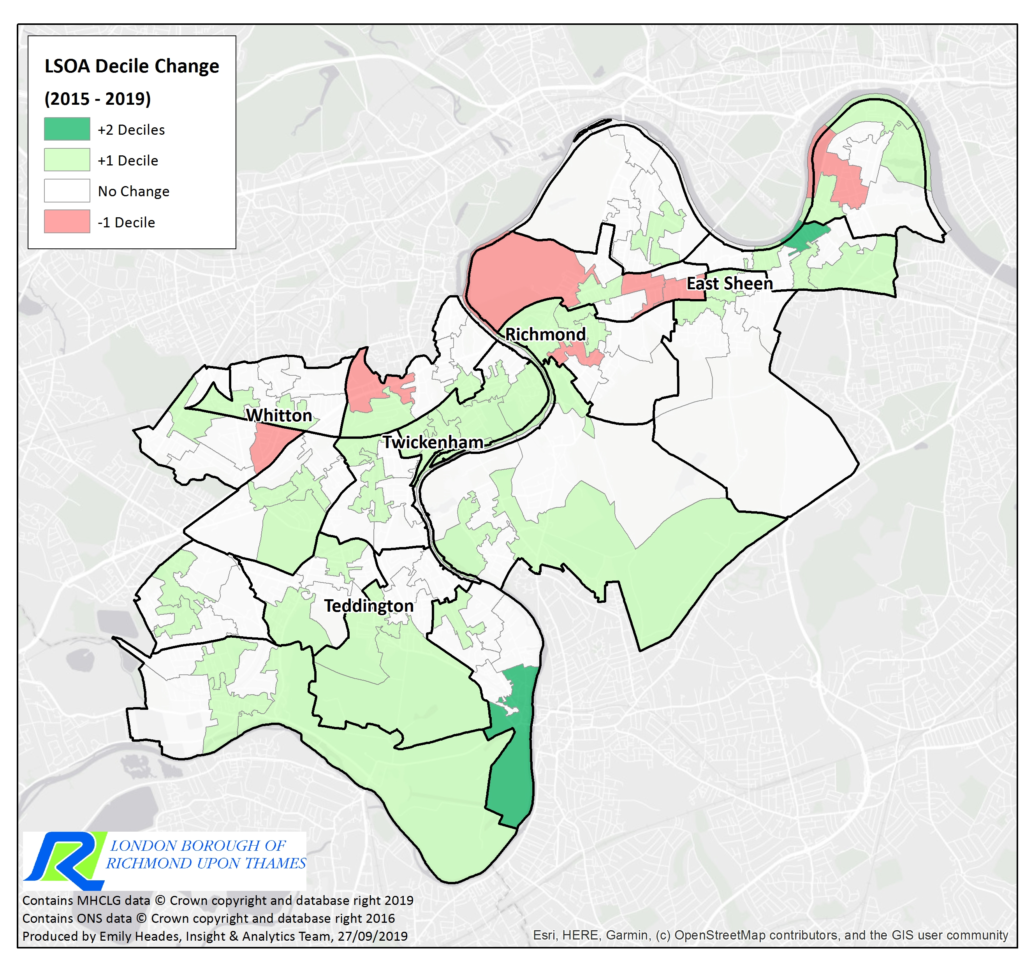
- Richmond’s more deprived LSOAs are dispersed throughout the borough (Figure 3) but those that are ranked as relatively more deprived since 2015 (moving down IMD deciles) tend to be in the north of the borough (Figure 4).

Figure 3 LSOAs mapped by IMD decile – blue shades are more deprived and yellow shades are less deprived. The hatched areas in the inset depict LSOAs amongst the 50% most deprived in England (deciles 1-5).
 Figure 4 LSOAs mapped by change in IMD decile between 2015 and 2019 – Red areas are relatively more deprived and green areas are relatively less deprived.
- Similarly to 2015, 11% of Richmond residents live within the 50% most deprived LSOAs nationally in 2019, a smaller proportion than London where over 60% of the population live in the 50% most deprived LSOAs in England (ONS mid-2017 small area population estimates).
- Within the Living Environment domain, 90% of Richmond residents live in the 50% most deprived LSOAs nationally compared to 85% of the London population.
- Regionally and locally, the more deprived LSOAs in the Living Environment domain were towards the north and east of the borough.
- Richmond had one LSOA that ranked amongst the 10% most deprived in London (up from 0 LSOAs in 2015) – this LSOA is home to 1,500 residents.
- Within London (regionally), half of the LSOAs in Richmond were ranked as relatively more deprived (moved down deprivation deciles) in the Crime domain. Now, 23% of LSOAs in the borough fall amongst the 50% most deprived LSOAs in London compared to 9% in 2015. All of those already amongst the 50% most deprived in 2015, moved down into a more deprived decile in 2019.
LSOA Dashboard
Ward Level Findings
- The LSOA that ranked amongst the 10% most deprived in London was in Hampton North.
- South Twickenham had no LSOAs that ranked amongst the 50% most deprived nationally, regionally and locally on the Index of Multiple Deprivation (IMD). Nationally and regionally there were more wards with no areas amongst the 50% most deprived.
- All LSOAs in Heathfield were amongst the 50% most deprived locally on the IMD. Hampton North also had a high proportion of LSOAs amongst the most deprived nationally and regionally.
- At the regional level, North Richmond had the most LSOAs ranked as relatively more deprived (moving down deprivation deciles) in the Income (71%) and Employment (57%) domains between 2015 and 2019. Regionally and locally, 100% of LSOAs in North Richmond moved into a more deprived decile for Crime.
- Locally and nationally, Twickenham Riverside had the most LSOAs moving up into a less deprived decile.
Ward Level Dashboard
Other resources related to the Indices of Deprivation can be found on our Links & Resources page.

