1 Executive Summary
1.1. A&E, MIU, UCC, WIC
The volume of activity in minor and major A&E has remained relatively stable since 2012/13 (around 39,724 and 40,740 attendances respectively in 2014/15, costing £8m in total).
- However, the percentage of major A&E attendances missing the four-hour target increased in 2014/15, rising to almost 14% by the final quarter of the year.
- 26% (10,630 attendances) of major A&E attendances were admitted to the emergency department, 29% (11,940) were discharged without a need for follow-up.
- While A&E attendances remained stable, the number of A&E treatments delivered doubled, indicating an increase in number of treatments per attendance.
- The average number of treatments per major A&E attendance has increased from 1.5 in 2010/11 to 2.2 in 2014/15.
- Over the past five years, monthly variation in A&E attendance has changed, with elevated patient numbers now arising outside of the winter period.
Pattern of A&E attendance Richmond CCG in 2014/15
- The majority of minor and major A&E attendance happens between 8am and 6pm.
- The walk-in centre sees an increase in attendance at the weekend.
- Other A&E service providers see roughly equal attendance every day of the week, with elevation on Mondays.
- 58% of major A&E attendances (23,827) presented without a referral.
- 29% of major A&E attendances (11,940) were discharged and did not require follow-up treatment.
1.2. Emergency admissions
Emergency admissions cost £30m in 2014/15 and admissions increased 5% to 13,262
- The winter months typically see the highest levels of emergency admissions.
- One-third of total costs arise in Kingston Hospital, one-third in West Middlesex University Hospital and the remaining third in all other providers.
- Injury poisoning and consequences of external causes (£5m) and problems with the respiratory and circulatory systems (£4.3m each) drove costs in emergency admissions.
1.3. Urgent care system
Services are not all utilised by the same age groups:
- Children account for 25% of major A&E attendance (10,276), particularly under-5s (12%, 5,004 attendances), and 32% of minor A&E attendance (12,667). Under-5s make up 8% of emergency admissions (1,096).
- 41% of both emergency admissions (5,357) and ambulance service call-outs (10,516) were by those aged over 70 years, with falls being the main reason for ambulance call-outs.
Community care also plays a role in responding to urgent care needs:
- The number of calls answered by NHS111 in Richmond doubled in 2014/15 to 15,839 calls. A similar proportion of calls were triaged in 2014/15 as the previous year. Given the increase in the total number of calls, this means that a larger absolute number of patients were referred to other services.
Delayed transfers of care have increased in Richmond, with delays owing to social care increasing more steeply than those owing to the NHS alone
2 Introduction
2.1. Aim
- To analyse the volume, characteristics and patterns of service use in the urgent care sector
- To understand relationship between different parts of the urgent care system
This needs assessment report sets out the current and future challenges for the urgent care sector in Richmond. This affects patients, their carers, families, the NHS and social care in Richmond.
It seeks to identify key messages to guide the development and commissioning of services for people with an urgent care need.
For further information and further detail on the report, please contact Public Health Richmond.
2.2. Audience
This needs assessment report is intended to inform the policies, strategies, development and commissioning plans, and practice in local organisations including Council teams, NHS organisations such as the Clinical Commissioning Group (CCG) and Trusts, and other organisations, such as the voluntary sector and representatives of the public and patients.
3 Background
3.1. Introduction
The Urgent Care Annual Report 2013/14 focused on seasonal and temporal trends in emergency admissions and A&E attendance. In response to increasing emergency admissions nationally, attention is shifting towards the broader range of services where patients with an urgent need for care can seek help. The percentage of major A&E attendances missing the four hour waiting target in Richmond in 2014/15 was at its highest in the last five years, reflecting the national trend. Nationally, there is much research being undertaken to understand where these pressures arise and how they can be alleviated.
3.2. Methods
On 29/10/15, the initial urgent care report proposal paper was taken to SRG. Feedback taken and used to produce scoping paper, which was circulated on 27/11/15. Indication was given to commence with analysis. The draft report was taken to SRG for comments on 21/1/16. Feedback was taken and used to produce this final report. On the basis of the feedback received from SRG, it was agreed to extend the focus of the Systems Resilience Annual Report 2014/15 beyond emergency admissions and A&E attendances, as was the focus in 2013/14, to the wider urgent care system.
3.3. Data sources
Secondary Uses Service, London Ambulance Services, Delayed Transfers of Care, NHS 111 Minimum Data Set.
3.4. Caveat
- This analysis presents hospital activity in terms of the absolute number of units (attendances, admissions etc.), rather than number of patients, as this more accurately represents the burden on healthcare.
- Due to limited resources, it was not possible to map an individual patient through the system. When the outcome of an attendance was recorded as not requiring follow-up treatment, it is not known whether the patient presents again with the same condition. Mapping the care journey of a certain condition through the system would allow identification of patients who present repeatedly for the same condition.
- The data as to why people present to services it not always accurately recorded, particularly in A&E, which limits the analysis that can be undertaken on which conditions drive urgent care attendance
- A&E attendance and emergency admissions split by GP practice are included in the clinical network public health data pack, on a quarterly basis and thus omitted from this analysis.
- Both urgent and primary care services are available at a walk-in centre. The data in this analysis classes all care given in the Walk-in centre as urgent care.
- The data presented for major A&E attendance combines both Type 1 and Type 2 emergency attendance. This means that all attendances at West Middlesex Hospital were included in major A&E, although there is an Urgent Care Centre at the site.
4 Local Picture
A summary of the findings from all urgent care services is provided in this section. For a more detailed breakdown of findings, please contact a member of the public health team, who can provide a copy of the full report.
4.1. Volume of activity across the system
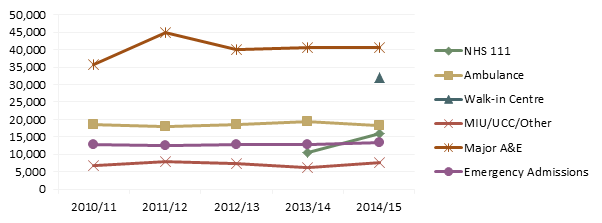
The number of calls answered by NHS111 in Richmond doubled in 2014/15 to 15,839 calls. Ambulance call-outs decreased 6% from 19,285 to 18,213. Minor and Major Accident and Emergency services saw roughly the same number of attendances between minor (39,724 attendances) and major A&E (40,740 attendances) services. A trend in walk-in centre attendance cannot be determined given a change in data collection practices. The absolute number of attendances has remained largely unchanged on last year but the percentage of major A&E attendances missing the four-hour waiting target increased in 2014/15. There has been a 5% increase in emergency hospital admissions in 2014/15, rising from 12,673 to 13,262.
Figure 1: Absolute numbers utilising urgent care provider services, Richmond 2010-15
4.2. Costs
Emergency admissions are the most expensive form of urgent care and cost a total of £30m in 2014/15. One-third of total costs arise in Kingston Hospital, one-third in West Middlesex University Hospital and the remaining third in all other providers. To take a very crude average cost per case, minor A&E attendance costs just below £70, major A&E costs £130, whereas an average emergency admission costs £2,200. The cost range of non-elective admissions is from £0 – £31,756, which goes up to £38k when local MFF is taken into account.
Table 1: Total activity, Costs and average cost per unit of activity in Richmond 2014/15
|
Total Activity |
Total Costs |
Average cost per unit of activity |
|
|
Walk-in Centre |
32,092 |
£2,150,164 |
£ 67 |
|
MIU/UCC/Other |
7,632 |
£524,609 |
£ 69 |
|
Major A&E |
40,740 |
£5,351,753 |
£ 131 |
|
Emergency Admissions |
13,262 |
£29,255,991 |
£ 2,206 |
4.3. Main providers
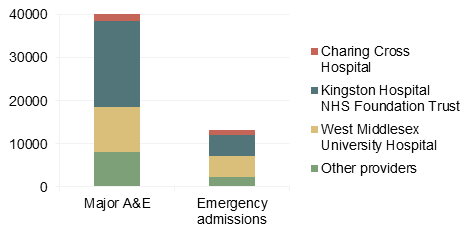
Minor A&E is delivered to the residents of Richmond primarily by the Teddington Memorial Hospital’s Walk-in centre, Queen Mary’s Hospital Minor Injury Unit, and Charing Cross Urgent Care Centre. The three main providers of major A&E services to the Richmond population are Kingston Hospital, West Middlesex University Hospital and Charing Cross Hospital. Accordingly, these three hospitals also accommodate the highest number of emergency admissions.
Figure 2: Absolute numbers of major A&E attendance and Emergency admissions by 3 main providers, Richmond 2014/15
4.4. Timing of attendance
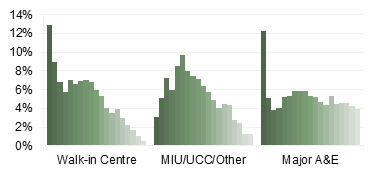
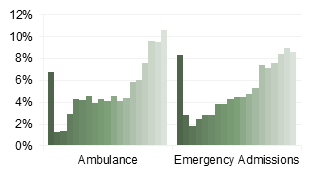
Figure 3: Time of day of attendance
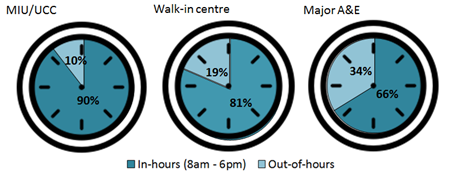
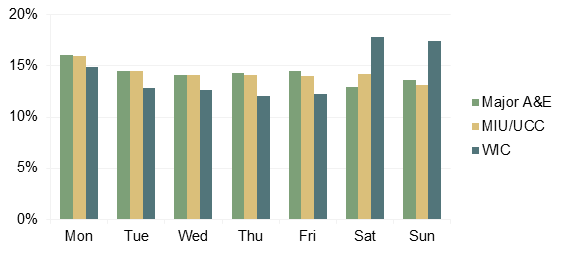
Minor A&E attendances occur predominantly during office hours. Urgent care centre and Minor Injury Units have a similar number of attendances every day of the week, but peak on Monday. The walk-in centre sees more attendees at the weekend, than during the week. Over the past five years, monthly variation in A&E attendance has changed, with elevated patient numbers now arising outside of the winter period.
Figure 4: A&E attendance in Richmond 2014/15, by day of the week
4.5. Age groups
There is a divide in which age groups predominantly use different services. The 0-9 year old age group makes up the largest numbers in walk-in centre and major A&E attendance, driven mainly by children aged under-5. MIU and UCC have the largest attendance from people in their twenties. Ambulance call-outs and emergency admissions are higher among the older population and in particular, highest among those aged over 80.
Young children and older adults draw particular attention, as they frequently seek to use urgent care services
- Under-5s: 13% (4,137) of walk-in centre attendance and 12% (5,004) of major A&E attendance are the in children under the age of 5. This young age group also accounts for 8% of emergency admissions (1,096)
- Older adults 75+: Rarely visit minor A&E and visit major A&E at roughly the same percentage as the general population (excluding under 5s). 37% of ambulance call-outs and 34% of emergency admissions were those aged over 75.
- Whereas there is a lot of activity in major A&E, emergency admissions are far more costly and this may be more worthy of consideration on cost implications
Figure 5: Proportion of services attended in Richmond CCG 2014/15, by age group
Most frequented by younger people Most frequented by older people

4.6. Referral source/Entry point
When faced with an urgent care need, a patient can choose to seek help from any service. This can be in the community e.g. through self-care or at a community pharmacy, via a primary care provider, by attending a minor or major A&E provider without appointment. NHS111 can provide advice on the most appropriate care setting and the ambulance facilitates speedy transportation to the setting. Service providers can refer patients to a setting more appropriate for treating the given condition.
Overall, the ambition within the system is to provide appropriate services in the appropriate setting, at the right time, to reduce unnecessary emergency admissions, which are both costly and distressing to patients. Work has been undertaken to encourage this, but more could be done. The main pathways are highlighted in the figure below.
Figure 6: Patient Urgent Care Pathway
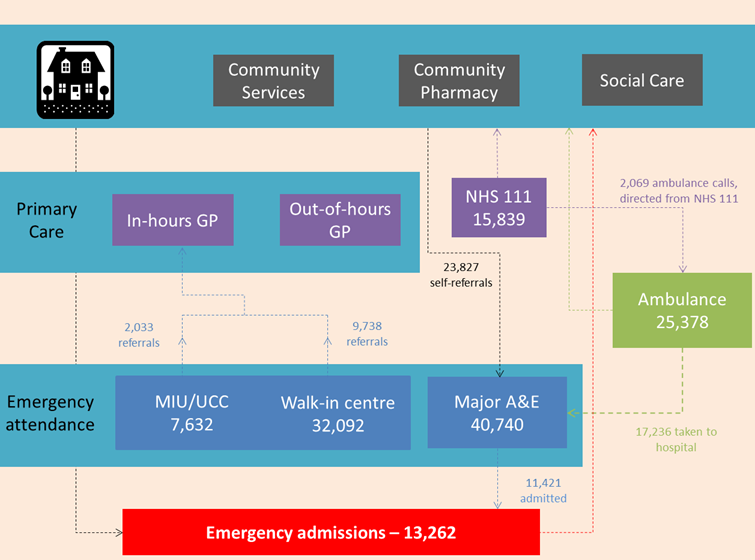
People with an urgent care need predominantly self-refer; 58% major A&E attendances (23,827) did so without a referral from another healthcare professional; 84% of walk-in centre visits (26,826) were self-referred. Patients will typically go to a major A&E department before being urgently admitted to hospital (86%, 11,421 attendances). Understanding the pathway of a patient between services is complex and the data often missing or inconsistently recorded.
4.7. Reasons for attendance
Poor data quality makes it difficult to accurately quantify reason for A&E attendances, for example, the reason that patients present was known in only half of walk-in centre attendances.
The reason for calling an ambulance was better recorded, but still lacking – 26% of attendances were un-coded. Emergency admissions were more consistently recorded.
- Ambulance attendance: the three most common reasons ambulance services were called were falls, breathing problems and unconsciousness/fainting
- Emergency Admissions: symptoms, signs, and abnormal findings; injury poisoning and consequences of external causes; respiratory systems problems.
These services are frequented more by an older population than A&E services, so it is likely that the conditions for which people attend here are not the same in the other services.
4.8. Outcome/Conversion rates
74% of incidences (18,819) to which an ambulance was called were transported to a healthcare facility, i.e. conveyed. 92% of conveyed call-outs were transported to an A&E department, the rest were transferred to other facilities such as Urgent Care Centre, Stroke Unit or Maternity ward. The three major A&E departments to which Richmond residents are most commonly conveyed are Kingston (7782), West Middlesex (7457) and Charing Cross (1076) hospitals.
Half of walk-in centre attendances (16,077) were discharged without a need for follow-up treatment. The other half were to receive follow-up from their GP (9,738) or referred to another healthcare provider. 29% (11,940) were discharged from major A&E without a need for follow-up, 26% (10,630) were admitted to the emergency department, and a further 38% were referred to another healthcare provider. The average number of treatments per major A&E attendance has increased from 1.45 in 2010/11 to 2.24 in 2014/15.
Figure 7: Trend in number of treatments delivered, in Major A&E departments, given number of A&E attendances in Richmond 2010/11 – 2014/15
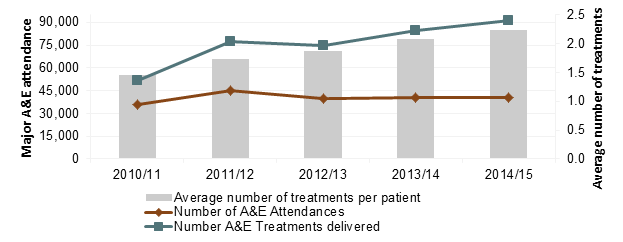
It is difficult to understand the appropriateness of the outcome of an attendance, without knowing the reason for which the patient has attended, or if a patient presented with the same condition again later.
4.9. Community
The number of calls answered by NHS111 in Richmond doubled in 2014/15 to 15,839 calls. A similar proportion of calls were triaged in 2014/15 as the previous year. Given the increase in the total number of calls, this means that a larger absolute number of patients were referred to other services.
Community pharmacies provide preventive services such as flu vaccinations (2,342 vaccines) predominantly to vulnerable people e.g. those over 65 years of age (63%: 1,469 vaccines) or people under 65 chronic respiratory disease (319 people).
Delayed transfers of care increased in Richmond throughout 2014/15, amounting to 4,612 delayed days. Delays owing to social care increased more steeply than those owing to the NHS alone.
5 Conclusions
5.1. Four-hour target
While the number of major A&E attendances has remained stable, the percentage of attendances missing the four-hour target increased in 2014/15, rising to almost 14% by the final quarter of the financial year. Evidently these delays are being driven by something other than absolute numbers attending. Some factors potentially contributing to this increase have been uncovered in this report, but they are by no means exhaustive and further investigation is needed. Since 2010/11:
- The number of A&E attendances has remained roughly stable whilst the number of A&E treatments delivered doubled. There are a number of reasons potential reasons for this, including increased complexity in cases, or change in protocol.
- Seasonal patterns in A&E attendance have varied and elevated patient numbers now arise outside of the winter period.
5.2. Utilisation of A&E/MIU/UCC/WIC
In order to plan services it is important to understand how patients currently use them. In 2014/15:
- The majority of minor and major A&E attendance happens between 8am and 6pm.
- The walk-in centre sees an increase in attendance at the weekend. Other A&E service providers see roughly equal attendance every day of the week, with elevation on Mondays.
- 29% of patients were discharged from major A&E, without a need for follow-up treatment. It may warrant looking at this group of patients to see which ones were “true emergencies” and which ones could have received care in the community. 58% of patients (23, 827) self-referred to A&E, perhaps suggesting that major A&E is often considered the first port of call.
5.3. Emergency admissions
Emergency admissions cost £30m in 2014/15 and admissions increased 5% to 13,262
- One-third of this is spent in Kingston Hospital, one-third in West Middlesex University Hospital and the remaining third in all other providers. Work has been undertaken, under the Better Care Fund, to try to reduce emergency admissions for ambulatory care sensitive conditions.
- 41% of emergency admissions were for those over 70 years of age. Are there barriers to older adults accessing services in the community, which could have the potential to prevent an emergency escalation?
5.4. Community care
Community care is an area where a large amount of urgent care is provided, but there is a lack of data on this topic e.g. data on attendance at out-of-hours GP services were not available. Data were available on a number of services and revealed interesting trends
- The number of calls answered by NHS111 in Richmond doubled in 2014/15 to 15,839 calls. A similar proportion of calls were triaged in 2014/15 as the previous year. Given the increase in the total number of calls, this means that a larger absolute number of patients were referred to other services.
- How quickly people can be released from hospital is also a cause mooted as potentially clogging the system. The number of days of delayed transfer of care has been increasing in Richmond, quicker than England, while London has been decreasing slightly. In particular, number of delayed days owing to social care has increased over 2014/15.
- People also self-manage conditions and the community pharmacy can play a supportive role in this, particular given that 99% of Richmond residents are within a mile of one. Pharmacies also provide commissioned preventive services that can reduce the need to seek care from a GP or A&E.
5.5. Areas for further investigation
- The number of A&E attendances has remained roughly stable whilst the number of A&E treatments delivered doubled. Whether it is complexity of cases causing this increase, staffing, protocols or some other cause.
- Considering the stable number of A&E attendances, explore what could be driving the increasing proportion of patients missing the 4-hour A&E waiting time
- 29% of patients were discharged from major A&E, without a need for follow-up treatment. It may warrant looking at this group of patients to see which ones were “true emergencies” and which ones could have received care in the community
- Map patient through the system. It is difficult to understand the appropriateness of the outcome of an attendance, without knowing the reason for which the patient has attended, or if a patient presented with the same condition again later.
- Emergency admissions have the highest cost, at £30m in 2014/15. Further investigation of this cost is needed, to identify conditions that are still being urgently admitted, when a community intervention earlier may have reduced the need.
- Are there barriers to older adults accessing services in the community, which could have the potential to prevent an emergency escalation?
6 Recommendations
It is recommended that the findings identified in this report are used to inform the Urgent Care Transformation programme which is currently underway.
Document Information
Published: July 2016
For review: July 2017
Topic lead: Anna Raleigh, Joint Acting Director of Public Health