This report is largely based on the content of a chapter from the 2013/14 Report of the Director of Public Health, London Borough of Richmond upon Thames published in January 2014.
However, based on an update of content and review of conclusions, this report was published in November 2015.
1 Introduction
1.1. Aim
This needs assessment report sets out the current and future challenges that are presented to children in Richmond. It also highlights key messages to guide the development and commissioning of services for children.
1.2. Who is this for?
This needs assessment report is intended to inform the policies, strategies, development and commissioning plans, and practice in local organisations including Council teams, NHS organisations such as the Clinical Commissioning Group (CCG) and Trusts, and other organisations, such as the voluntary sector and representatives of the public and patients.
2 Background
2.1. Increased focus on outcomes
The importance of outcomes in health and local government has been widely recognised for many years. This includes outcomes ranging from people dying prematurely to the quality of life of service users.
Over recent years, both at national and local levels, different models and tools have become available that allow a more systematic approach to defining and measuring outcomes. This has allowed us to focus more on results from services and investments – rather than activity (e.g. numbers of people attending services).
This report demonstrates the use of one set of tools – National Outcomes Frameworks – that help us to focus on measuring and assessing the health and wellbeing outcomes of the people of Richmond borough.
2.2. National Outcomes Frameworks
Four National Outcomes Frameworks have been developed in recent years – Adult social care[1], National Health Service (NHS)[2], Public Health[3] and Children & young people[4]. The outcomes frameworks are sets of validated indicators provided at local authority level, which can be benchmarked against other areas.
Many of the indicators are already reported and monitored through other local and national reporting systems for topic areas, although they might not be recognised as being part of the national outcomes frameworks. The frameworks are freely available on the internet and are regularly updated.
It is important to be aware that the frameworks do include a mixture of indicators – some are high-level population measures whereas others focus on individual experiences (measured at a local authority level); some indicators can be affected by short term changes whereas others can only be changed over long periods of time; some are relatively straight forward to improve whereas others are complex and multifactorial; some can be affected by local-level initiatives whereas others may be more influenced by national level changes.
The four frameworks are complementary and together provide an overview of the health and wellbeing of local populations. The combined frameworks provide a structure for measuring and monitoring improvements across public health, healthcare, children’s and social care systems and to support partnership working and integration, as single services or sectors cannot achieve the outcomes on their own.
2.3. Purpose of the report
This year’s report is based on an analysis of Richmond borough’s position across the full range of indicators in the National Outcomes Frameworks. In bringing together the outcomes frameworks, we aim to support joint working on outcomes shared between local partners.
The report will provide a concise reference source to make sense of the indicators from the outcomes frameworks and to understand what they mean for Richmond borough. This report seeks to make these datasets accessible to a wider audience by exploring what the indicators actually measure and how the data is collected, interpreting Richmond borough’s performance on the indicators (both in absolute numbers and benchmarked against other areas) and judging how useful and robust the indicators are in monitoring the health and wellbeing of the local population.
It is outside the scope of this report to describe, evaluate or make recommendations on local strategies, interventions or current or planned programmes of work to improve Richmond borough’s performance on the indicators, although some indicators do relate specifically to local programmes or services. However, the report does signpost readers to further sources of local information, such as local strategies or Needs Assessments (although this is not meant to be a comprehensive list) – this is to be found in Appendix A.
2.4. Methodology
Engagement
In developing this report, the Public Health team has engaged with colleagues across the local authority, Achieving for Children and the Richmond Clinical Commissioning Group (CCG) who understand the details of how the indicators have been constructed and how to interpret Richmond borough’s performance. These have often been the leads responsible for collecting and submitting data on the indicators and/or the strategic leads for a topic area. This has been a very positive process and has been helpful in coming to a common understanding.
Indicators
The indicators used in this report are drawn from the NHS Outcomes Framework (NHSOF), the Public Health Outcomes Framework (PHOF), the Adult Social Care Outcomes Framework (ASCOF) and the Child Health Profiles (CHP). All outcome indicators are included in this report to ensure a comprehensive and transparent picture.
There are a total of 170 indicators in the outcomes frameworks – 118 from PHOF, 25 from NHSOF, 22 from ASCOF and 30 from CHP. There is overlap between the frameworks, with some indicators belonging to more than one framework. Data are correct as of 31st October 2014. The index in Appendix B provides the framework references for each indicator.
The outcome indicators are presented according to five categories or ‘domains’ – each domain is the focus of a chapter in the report. The five domains are: improving the wider determinants of health, prevention & early intervention, integrated health & social care, children & young people and reducing premature mortality. We are aware that there are other ways to group up the indicators, but this was deemed to be the most useful for the purpose of this report. A chapter has been specifically dedicated to children & young people because there is a separate Outcomes Framework for this age group and there are dedicated services to meet many of their needs. The other chapters are based on themes that cross all age groups but are mainly focused on adults. It was not feasible to have a separate chapter on older people, although it is acknowledged that this is an important group, and they are well covered in the chapter on integrating health and social care.
Outline of each chapter
Each chapter in the report comprises a summary profile of relevant indicators and an interpretation of Richmond borough’s position. Links to relevant local documents (e.g. local strategies or Needs Assessments) have been included in Appendix A, so that readers can find more detailed information.
Comparator areas
For most indicators, the peer comparison is London boroughs or CCGs[5]. The exception is those indicators which are derived from the ASCOF, in which case the comparison is against boroughs selected using the Chartered Institute of Public Finance and Accountancy (CIPFA) Nearest Neighbour Model, which identifies similarities between authorities based upon a range of socio-economic and demographic indicators.[6]
The national comparisons are drawn between London Borough of Richmond upon Thames (or Richmond CCG, where necessary) and the rest of the boroughs (or CCGs) in England.
The majority of data sources break data down by upper-tier authority – 156 authorities in England and 33 in London. However, a small number of data sources break data down by lower-tier authority – 326 authorities in England and 33 in London. As for CCGs, there are 211 in England and 32 in London.[7]
There are many instances in which data are not available for all comparators in a group. Where this occurs, the Richmond borough data is simply compared against those comparators for which data are available.
Ranking of areas
Richmond borough’s performance is coded according to the quartile in which it falls, when compared to other areas. This is calculated by ranking the full set of areas (e.g. local authorities within England) according to their performance on a given indicator, and splitting the list into four groups of equal number. The first group contains the top (best performing) 25% of areas, or first quartile.
There are a number of caveats with using this methodology:
- This methodology differs from that employed by PHOF and CHP, which looks at statistical similarity or difference to local or national comparators.
- Quartiles give an indication of performance relative to the other comparator areas, irrespective of how the data is distributed.
- This method takes no account of absolute standards, such as national targets for certain outcome indicators (e.g. childhood immunisations). Relative performance may be shown to be good/green, even when a target has been missed.
- In London, the small resident population of the City of London makes it a statistical outlier. This may slightly skew the overall London figure and the calculation of the quartiles.
Rankings are therefore not necessarily the primary basis for performance management, but are a helpful way of comparing Richmond borough’s performance with other areas – offering simplicity of analysis, ease of interpretation and consistency across the four frameworks. Using the rankings may help to identify areas where improvement may be required.
Colour coding
Dark green (and a number 1) indicates Richmond borough performance in the top (best performing) quartile, light green (2) and amber (3) indicates performance in the second and third quartiles respectively, and red (4) indicates performance in the bottom quartile.
For some indicators, higher values are preferable (e.g. vaccination coverage) and, for others, lower values are preferable (e.g. mortality rates); the colour codes reflect this, so that green always indicates the desirable direction of performance. In some cases, the polarity of an indicator is ambiguous, in which case performance has been ranked smallest to largest, with low values marked green and higher values red. This is detailed visually in Table 1. For black and white printing, the quartile number (1-4) has been included.
Table 1. Colour-coding of performance by quartile 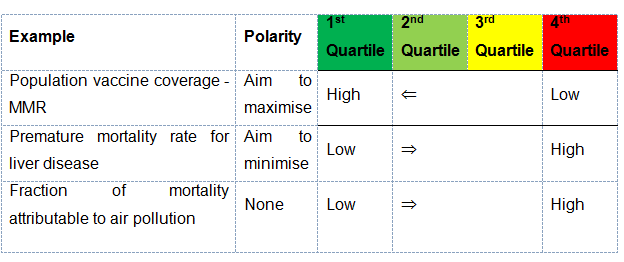
Recent trends
The recent trend based on the last few years data (up to 5 years, where available) for each indicator is shown symbolically:
+ Increasing
= No clear trend/stable
– Decreasing
The direction of each trend was a subjective judgement, based on the data available. It was not based on a statistical analysis or modelling. Trends were judged by two reviewers to ensure agreement.
Where there are fewer than three years’ data available, a trend has not been inferred, due to the uncertainty around the degree of year-on-year variation.
3 Local Picture
3.1. Introduction
There is now strong evidence demonstrating that what happens early in life affects health and wellbeing in later life[8]. Furthermore there is a strong economic case for improving the health and wellbeing outcomes of children and young people- the long term societal costs of adverse outcomes such as premature births, childhood obesity and mental health are significant.
The new Children and Families Act 2014 reflects this life course perspective –with reforms particularly relating to Special Educational Needs and Disabilities (SEND) as an opportunity to improve the life chances of those with additional needs.
Improving health and wellbeing is a key aim of Richmond borough’s Children and Young People’s Plan 2013-17. The outcomes indicators in this chapter help measure progress towards this aim.
3.2. Healthy start
 Key outcome indicators show that most children in Richmond borough have a good start in life.
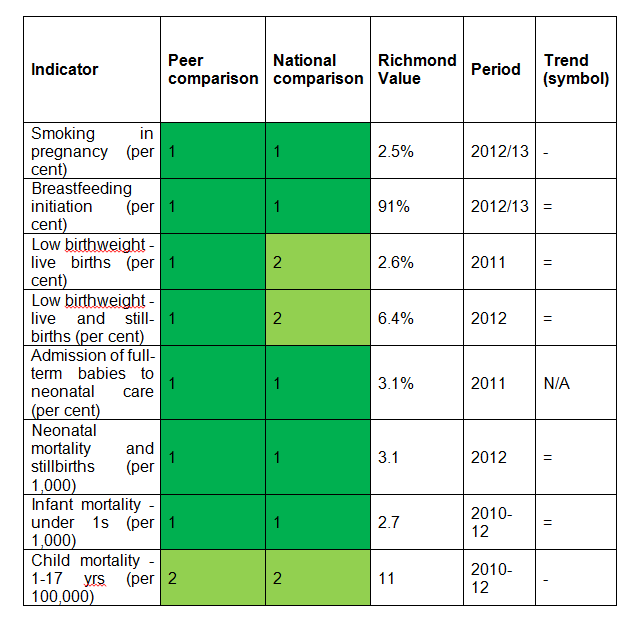
Few mothers in Richmond borough smoke during pregnancy – 2.5% (65) compared to 5.7% in London and 12.7% in England (2012-13). This is a reduction in Richmond borough from 4.2% in 2010/11. 91% of mothers (2,384) initiated breastfeeding compared to 87% in London and 74% in England. These positive outcomes are important predictors of a child’s healthy development.
In Richmond borough 2.6% of all live births at term in were low birthweight (under 2500g) in 2011, compared to 3.2% in London and 2.8% in England. This equated to 69 low birthweight babies. Richmond borough ranked tenth lowest in London for this outcome. However this is a slight increase in low weight births in Richmond borough compared to the previous five years. A similar pattern of performance is evident for the number of low weight births as a proportion of all live and still births.
Richmond borough rates of admission of full term babies to neonatal care are comparatively low – 3.1% of all full term births (83 babies), compared to 6.9% in England in 2011.
Infant mortality is a sensitive measure of the overall health of the population. Fewer infants die under one year of age in Richmond borough – 2.7 per 1000 live births, compared to 4.1 in London and England in 2010-12. This equated to 24 deaths, and there was a reduction from a rate of 3.3 in 2009-2011. This comparatively low level of infant mortality is a reflection of the positive living conditions that influence the overall positive health status of the Richmond borough population.
The Richmond borough child mortality rate (deaths at age 1-17 years) was 11 per 100,000 in 2010-12, compared to 14 in London and 13 in England. After the age of one, the commonest cause of death in young people is injuries. Although in Richmond borough the number of child deaths is small (13 deaths in 2010-12), some may be avoidable.
3.3. Readiness for school and education attainment
Early child development and educational attainment are important determinants of future health and wellbeing. Performance is influenced by quality of provision but most significantly by family social background.
‘School readiness’ is a key measure of a child’s developmental progress at five years of age at the end of the Early Years Foundation Stage – EYFS (end of reception). It is a key marker of early years’ experiences, including the quality of parenting and early learning environment.
Children are defined as having reached a good level of development (GLD) if they achieve at least the expected level in the early learning goals in the prime areas of learning (personal, social and emotional development; physical development; and communication and language, and the early learning goals in the specific areas of mathematics and literacy.
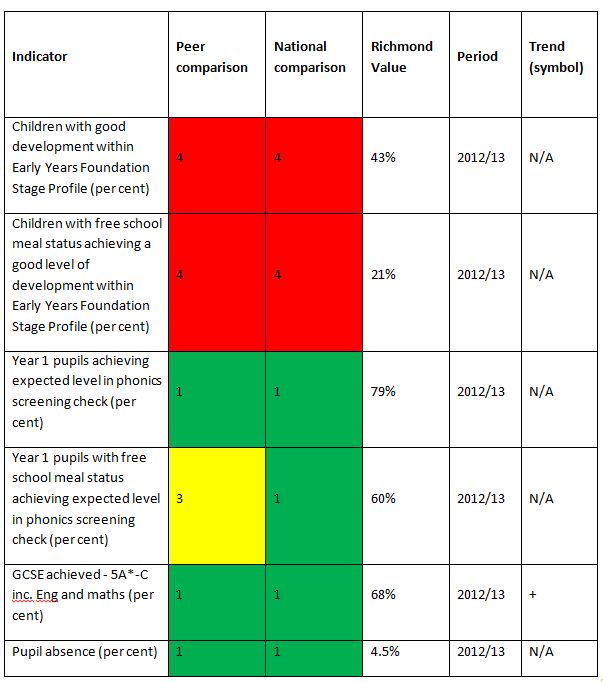
In 2012-13, 43% of children in Richmond borough achieved a good level of development. This was lower than the London figure of 53%, and England of 51%. However it is important to note that this is a new indicator that reflects significant recent changes in the way children are assessed at the end of the early years foundation stage. The comparatively low ranking of Richmond borough is likely a reflection of inconsistencies in applying this new assessment process in different areas.
In 2014 there was significant improvement, with 64% of Richmond borough children securing a good level of development, which was above the national figure (60%).
Nevertheless there is clear variation in this outcome measure among children in Richmond borough, with children from poorer social background doing less well. 21% of children with free school meal status achieved a good level of development.
School readiness is further assessed at Key Stage 1 using the measure of the phonics screening check at year 1. This is a measure of a child’s achievement against the expected level for a range of development areas (reading, writing, speaking and listening). At this stage Richmond borough achieved a higher ranking – 79% of Richmond borough pupils achieved the expected level, compared to 72% in London and 69% in England. This is the best in London and second best in England. However, the marked inequality seen in the readiness for school indicator also persists in this indicator, with 60% of pupils with free school meal status achieving the expected level in the phonics check.
In 2012-13, 68% of pupils achieved 5 or more GCSEs at grade A*-C including English and Maths in state maintained schools. This was the eighth highest in London. It is above the performance in London and England (65% and 61% respectively).
Richmond borough has the one of the lowest levels of pupil absence in London and in England (as measured by percentage of half days missed due to overall absence – authorised and unauthorised). In 2012-13 the Richmond borough absence rate was 4.5%, compared to 4.8% in London and 5.3% in England. This is an improvement in Richmond borough from 5.4% in 2010-11.
3.4. Vulnerable children and young people
Evidence clearly demonstrates that childhood poverty can lead to premature mortality and poor health outcomes in adulthood.
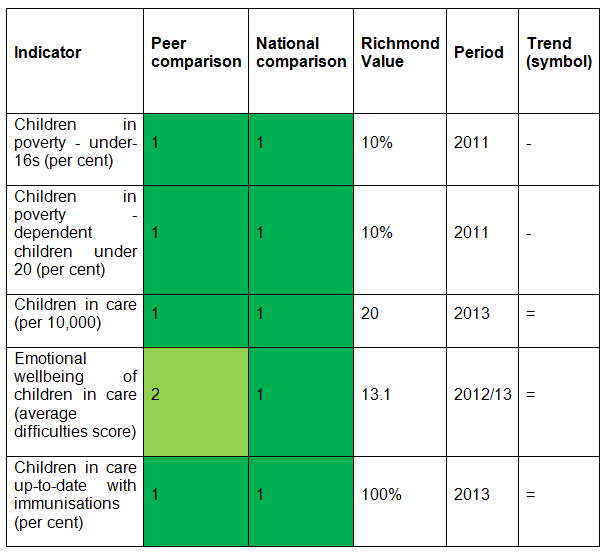
Ten per cent of children under 16 years live in poverty in Richmond borough, compared to 27% in London and 21% in England. These are children living in families in receipt of out of work benefits or tax credits where their reported income is less than 60% of median income. Richmond borough has the lowest level of child poverty of all London boroughs and the fifth lowest level of local authorities in England. This is a downward trend from 12% four years previously.
Although this is a positive outcome, around 3,500 children under 16 are living in poverty in the borough.
Children in care are a particularly vulnerable group and generally do worse than their peers in terms of their physical and mental health, and also their education. Richmond borough has low rates of the child population in care – 20 per 10,000 under 18 years, compared to 55 in London and 60 in England in 2013. This equates to 85 children and young people.
The emotional wellbeing of looked after children is measured as the average score reported on the ‘strengths and difficulties’ questionnaire (a validated tool for measurement of wellbeing). A higher score indicates greater difficulties (a score of under 14 is considered normal, 14-16 is borderline cause for concern and 17 or over is a cause for concern). This assessment tool is designed to ensure that risks relating to mental health, the breakdown of placement and poor educational outcomes are monitored and addressed. Children in care in Richmond borough have an average wellbeing (difficulties) score of 13.1, compared to 13.4 for London and 14.0 for England.
Richmond borough children in care are well supported by health services. Immunisation coverage for children in care (100%) is the best in London and among the best in England.
3.5. Immunisation
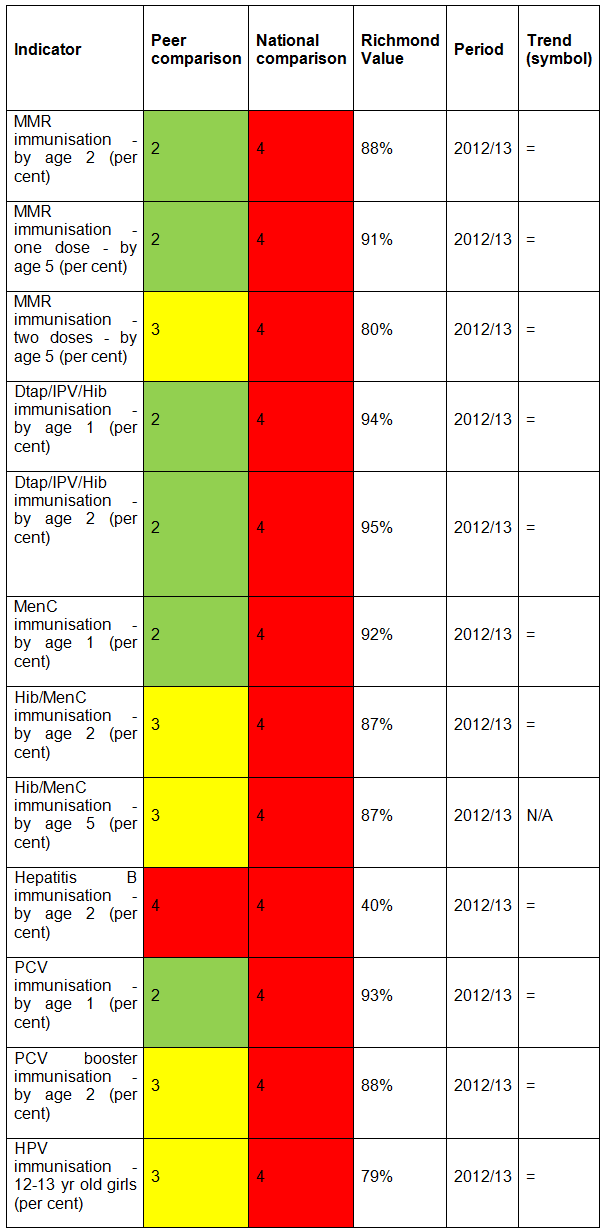
Vaccination coverage is the best indicator of the level of protection (immunity) that a population has against vaccine preventable communicable diseases.
Currently the European Region of the World Health Organisation recommends that on a national basis at least 95% of children are immunised against diseases preventable by immunisation – specifically diphtheria, tetanus, pertussis, polio, Haemophilus influenza type b (Hib) and measles, mumps and rubella (the MMR vaccine covers all three).
The indicators in the Outcomes Framework measure the level of vaccination coverage achieved for each of these different diseases. Richmond borough coverage is currently below the 95% level needed to protect all local children and young people from certain serious diseases.
Richmond borough has lower levels of coverage for all childhood vaccinations compared to the figures for England. Richmond borough’s performance ranks within the bottom 25% of boroughs in England. Richmond borough’s performance, compared to other London boroughs, is better. However, childhood immunisation coverage in London is widely incomplete against the target of 95%.
Childhood MMR vaccination coverage is particularly low. In 2012-13 in Richmond borough, 80% of children received 2 doses before the age of 5, compared to 89% in London and 88% in England. In Kingston 84% was achieved.
In the UK, all 12-13 year old girls (school year 8) are offered vaccination against Human Papilloma Virus (HPV) through the national HPV immunisation programme. The HPV vaccine protects against the two types of HPV that cause over 70% of cervical cancers. 79% of 12-13 year old girls in Richmond borough received the HPV immunisation in 2012-13 compared to 79% in London and 86% in England.
NHS England is responsible for commissioning immunisation programmes, and Public Health teams in local authorities are responsible for liaising with NHS England to ensure that effective immunisation programmes are offered to their local population.
3.6. Healthy weight
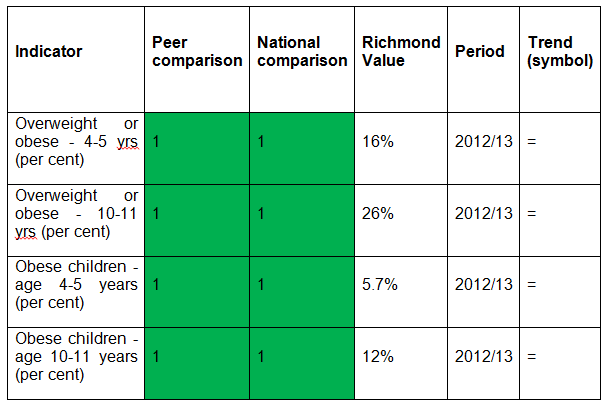
Children who are overweight or obese can experience poorer physical and mental health during childhood and are at greater risk of cardiovascular disease and diabetes in later life.
The outcomes indicators look at the levels of overweight children, including those children who are obese, among primary school aged children based on the findings of the National Child Measurement Programme (NCMP). This measures the weight and height of children in reception class (age 4-5) and year 6 (age 10-11).[9]
Levels of overweight and obesity among primary school aged children in Richmond borough are lower than in London and England (2012-13).
In reception year 16% of children (363 children) are overweight or obese, making Richmond borough the second lowest in London and eighth lowest in England. In Kingston 16% of children are overweight or obese. Six per cent of Richmond borough reception children are obese.
In Year 6 the level of overweight and obesity is 26% (404 children). Richmond borough has the lowest level of overweight and obesity at Year 6 in London. In Kingston 30% of children are overweight or obese. 14% of Richmond borough Year 6 children are obese.
Despite Richmond borough’s positive ranking, approximately 3,000 primary school aged children are overweight or obese. In addition, between reception and Year 6 levels of obesity double in Richmond borough (which reflects national trends). There has been a slight increase since 2006-7 in the percentage of children who are overweight and obese at Year 6, although a slight reduction at reception age.
3.7. Dental health
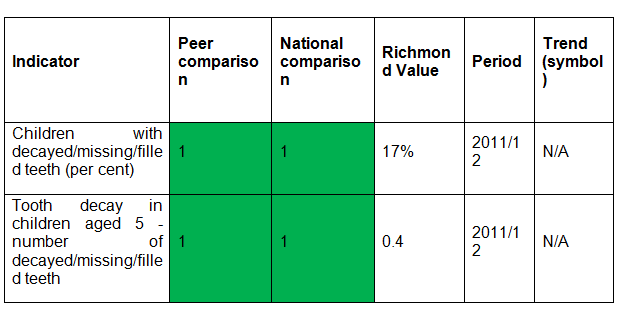 Two childhood dental health indicators are included in the Outcomes Frameworks. These are based on the regular national surveys conducted in state maintained primary schools, as part of the National Dental Epidemiology Programme (NDEP) for England. The indicators are good direct measures of dental health but also act as indirect, proxy measures of child health and diet.
In 2011-12, 17% of Richmond borough children aged 5 had one or more decayed, missing or filled teeth, compared to 33% for London and 28% for England. Richmond borough had the best (lowest) figure among London boroughs for this indicator.
‘Tooth decay in children in children aged 5’ measures the average number of teeth per child that are decayed or have been filled or extracted. Richmond borough has the best score (0.40 teeth) among London boroughs. London’s score was 1.23 and England’s was 0.94.
3.8. Sexual health
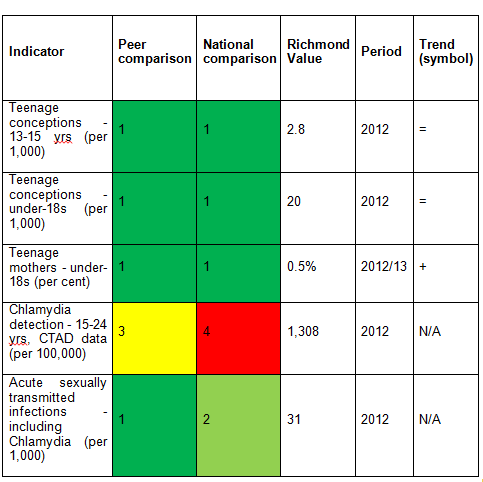 Teenage pregnancy is generally associated with poorer health, education and economic outcomes for young parents and their children. The teenage conception rate in Richmond borough is relatively low. Around 50 teenagers conceive per year in Richmond borough and one-third of these will go on to become teenage mothers.
Chlamydia is the most prevalent sexually transmitted infection (STI) in England, particularly among young adults. Most people with Chlamydia do not have any symptoms. If left untreated, Chlamydia infections can persist for months or years and can lead to long-term fertility problems. The National Chlamydia Screening Programme (NCSP) seeks to address this issue by regularly testing sexually active under-25s who do not have any symptoms.
The detection rate is used as a success measure of the NCSP which aims to identify asymptomatic cases that may not otherwise be diagnosed and treated. To help with interpretation of this indicator, the name of the indicator in the Public Health Outcomes Framework has recently been changed from ‘Chlamydia diagnoses’ to ‘Chlamydia detection rate’ – the higher the detection rate, the better. The NCSP recommends that local areas achieve a rate of 2,300 per 100,000 young people. In Richmond borough, the detection rate was 1,308 per 100,000 in 2012 (a red indicator) compared to 1,979 per 100,000 in England (London-wide data not available).
There are two elements to the NCSP – percentage of eligible age group screened each year (coverage) and percentage of those screened who receive a positive result (positivity). Both elements are slightly lower in Richmond borough than other areas. Using 2012 data, Richmond borough achieved 24% coverage compared to 26% in England, and 5.5% positivity compared to 7.7% nationally.
Richmond borough rates of acute STIs among young people (aged 15-24) are comparatively low at 31 per 1000, compared to 42 in London and 34 in England.
3.9. Use of drugs and alcohol
 Alcohol consumption and drug and alcohol misuse are markers of risky behaviours and vulnerabilities among young people.
Evidence suggests use of recreational drugs increase risks of damage to mental health including suicide, depression and disruptive behaviour disorders. Regular use of cannabis or other drugs may also lead to dependence. Other adverse outcomes of drug use include truancy, exclusion from school, homelessness, time in care, and serious or frequent offending.
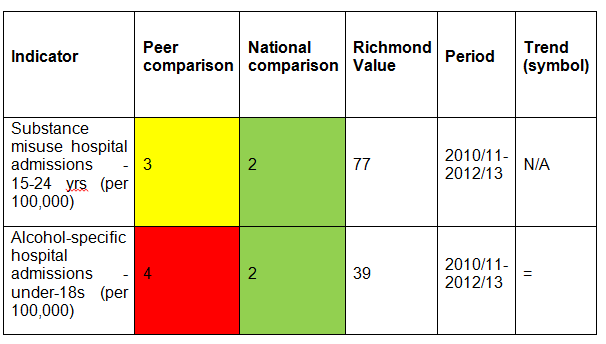
In Richmond borough, 77 per 100,000 15-24 year olds were admitted to hospital for drug related disorders, compared to London (58) and England (75) (2011-13). Although the numbers were comparatively small (41 young people), the amber rating indicates that some admissions are avoidable through prevention measures.
Alcohol misuse in young people is a major contributor to criminal and antisocial behaviour. Although evidence suggests that the number of teenagers who drink has decreased nationally in recent years, the amount of alcohol drunk by those who do drink has increased.
The Richmond borough rate of hospital admissions due to alcohol specific conditions (39 per 100,000 of under 18 year olds) was higher than London (29) but lower than England (43). Although again actual numbers for Richmond borough were small (16 young people), this is a red indicator for the comparison with London. Such admissions and related negative outcomes are potentially avoidable through prevention and early intervention measures.
3.10. Mental Health
Currently the national Outcomes Frameworks include two indicators that directly measure levels of mental health problems among children and young people. Nationally, one in ten children aged 5-16 years has a clinically diagnosable mental health problem and, of adults with long-term mental health problems, half will have experienced their first symptoms before the age of 14.
Also self-harming is known to be much more common in children and young people with mental health disorders – with 10% of 15-16 year olds having self-harmed.
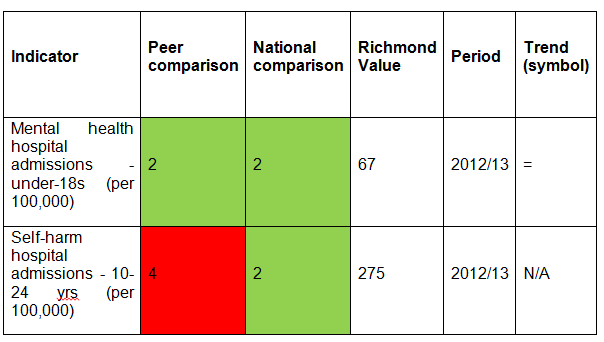
In 2012-13, the Richmond borough rate of hospital admission for mental health conditions under 18 years was 67 per 100,000 population – below the London and England rates (both 87). This compares with the rate of 48 per 100,000 population in Kingston. The Richmond borough rate equates to 28 young people under 18 years and there was a fall in the rate over the last three years.
In 2012-13, the Richmond borough rate of hospital admissions as a result of self-harm in those aged 10-24 years was lower than in England (275 per 100,000, compared to 346 for England). However, Richmond borough ranked the sixth highest among London boroughs (a red indicator). In a three-year period (2010-11 to 2012-13), there were 222 hospital admissions as a result of self-harm in those aged 10-24 years.
3.11. Hospital care
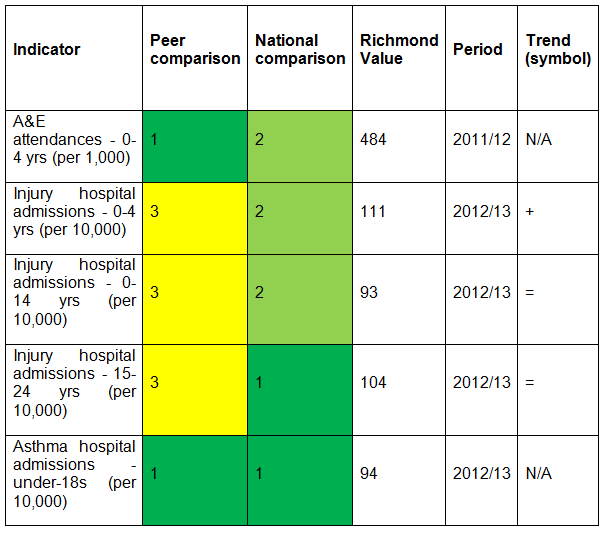
In 2011-12 there were 6,816 A&E attendances for Richmond borough children under 5 years. Richmond borough attained a positive ranking – with a rate of 484 per 1,000 population aged 0-4 years, compared to 693 in London and 511 in England. This was the lowest rate in London and is also an improvement from the previous year. Despite this comparatively positive ranking these attendances are often avoidable and many could have been treated in primary care.
Injuries (unintentional and deliberate) are a leading cause of hospitalisation and represent a major cause of premature mortality for children and young people. In 2012-13 there were 338 hospital admissions of Richmond borough children aged 0-14 years due to injury – 93 per 10,000 compared to 85 in London and 104 in England. There were 182 hospital admissions of Richmond borough 15-24 year olds due to injury (104.1 per 10,000 compared to 101 in London and 131 in England). Richmond borough’s rating in London is amber, while nationally it is green. This may be a reflection of the better performance of London boroughs overall (lower rates of hospital admissions).
Asthma is the commonest long-term medical condition in childhood. Emergency admissions should be avoided whenever possible. Richmond borough has significantly lower rates of emergency admissions for asthma for under-19 year olds than in London and England. In 2012-13 the Richmond borough rate was 94 per 100,000 compared to 212 in London and 221.4 in England. This Richmond borough rate was the lowest of all London boroughs and equated to 41 admissions, with a reduction seen from the previous year.
4 Local Services
A review of local services was not included as part of this needs assessment.
5 Conclusion
- Most children and young people living in Richmond borough are healthy and have a good start in life. Many of the outcomes for Richmond borough are better than in London and England. However not all children and young people enjoy similar positive outcomes and consequently have the same chances of good health when they are adults. This includes those with additional educational needs and those with disabilities.
- These inequalities in outcomes can be reduced through prevention and early intervention – the role of both universal and targeted health, children’s and education services. Early help is critical in helping buffer the impact of adverse family circumstances such as low income or parental mental health problems.
- ‘School readiness’ is a key measure of a child’s developmental progress at five years of age. Richmond borough had a low ranking in London and England in 2012/13. It is likely that this ranking reflects inconsistencies in applying the new assessment processes (recently introduced) in different areas. In 2014 there was significant improvement, with 64% of children securing a good level of development which was above the national figure (60%). Nevertheless there is clear variation in this outcome measure among children in Richmond borough, with children from poorer social backgrounds doing less well.
- Although levels of childhood poverty and rates of children in care are lower in Richmond borough compared to other local authorities, these children are at higher risk of experiencing poor outcomes throughout their lives unless services effectively intervene. There are an estimated 3,500 children under age 16 who are living in poverty in the borough.
- Richmond borough has lower levels of coverage for all childhood vaccinations compared to figures for England. Although local coverage has been improving year on year, it is currently below the 95% level needed to protect all local children and young people from serious infectious diseases.
- Levels of overweight and obesity among primary school aged children in Richmond borough are significantly lower than nationally. Nevertheless, approximately 3,000 primary school aged children are overweight or obese. In addition, between reception and year 6 levels of obesity double in Richmond borough (which reflects national trends).
- Richmond borough has the best performance in London on dental health of children. However, around one in six children aged five have at least one tooth that is decayed, missing or filled- these are wholly preventable.
- Richmond borough has a comparatively low teenage conception rate, but still around 50 teenagers conceive per year and one-third of these will become teenage mothers. The indicator for Chlamydia detection needs careful interpretation, as it is used as a success measure of a screening programme which aims to identify asymptomatic cases that may not otherwise be diagnosed and treated, i.e. the higher the rate, the better. Richmond borough has a relatively low detection rate (a red indicator).
- Alcohol and drug misuse are markers of risky behaviours and vulnerability among young people. The rate of hospital admissions for substance misuse among young people is lower than rates for London and England. However the Richmond borough rate of hospital admission due to alcohol-specific conditions (39 per 100,000 of under 18 year olds) was sixth highest among London boroughs. While actual numbers of alcohol and drug related admissions are small, such admissions are avoidable.
- In 2012/13 the Richmond borough rate of hospital admissions for self-harm in young people was the fourth highest among London boroughs. There were 222 admissions for self-harm over a three-year period.
- There are almost 7,000 A&E attendances in children under age 5 per year. Despite a comparatively positive ranking and improvement from the previous year, these attendances are often avoidable and many could have been treated in primary care.
- Injuries are a leading cause of hospitalisation and premature mortality among children and young people. In 2012/13 the Richmond borough rates for hospital admissions due to injuries for age groups under 25 years were lower than in England but above rates in London. This represented 520 admissions among children and young people under 25 years that may have been avoided through preventative measures.
References
[1] Adult Social Care Outcomes Framework, https://ascof.hscic.gov.uk/
[2] NHS Outcomes Framework, https://www.hscic.gov.uk/nhsof
[3] Public Health Outcomes Framework, https://www.phoutcomes.info/
[4] Children and Young People’s Health Benchmarking Tool, https://fingertips.phe.org.uk/profile/cyphof
[5] Some data sources precede the Health and Social Care Act 2012, so present data according to the CCG’s predecessors, primary care trusts (PCTs).
[6] Further information about the Nearest Neighbour Model can be found on the CIPFA website: https://www.cipfastats.net/resources/nearestneighbours. CIPFA comparator councils for Richmond borough upon Thames are: Barnet, Bexley, Bromley, Croydon, Ealing, Enfield, Harrow, Havering, Hillingdon, Hounslow, Kingston upon Thames, Merton, Redbridge, Sutton and Wandsworth.
[7] Previously, there were 152 PCTs in England and 31 in London.
[8] Chief Medical Officer (2013). Prevention pays: Our children deserve better
[9] Children’s heights and weights are measured and used to calculate a Body Mass Index (BMI) centile.
- Overweight is defined as a BMI greater than or equal to the 85th centile but less than the 95th centile (i.e. overweight but not obese);
- Obese is defined as a BMI greater than or equal to the 95th centile.
Document Information
Published: November 2015 For review: November 2018 Topic lead: Amanda Killoran, Public Health Principal[*]