1 Introduction
1.1. Aim
- To map the acute paediatric care pathway (main service components)
- To understand the pattern of use (throughput, presentations and outcomes) for:
- Local A&E departments/unplanned admissions
- General practices
- Local walk-in clinic
- To consult providers in each step of the pathway including general practitioners, those in walk-in centres, healthcare professionals in A&E departments and healthcare professionals working in hospital paediatric departments.
2 Background
2.1. Definitions
Effective use of services is defined by attendance at a service which is appropriate for the level of need of the patient, according to the intended pathway.
Effective functioning of services means that providers ensure patients receive the appropriate level of care according to need, with onward referral as necessary.
2.2. Model of acute care provision
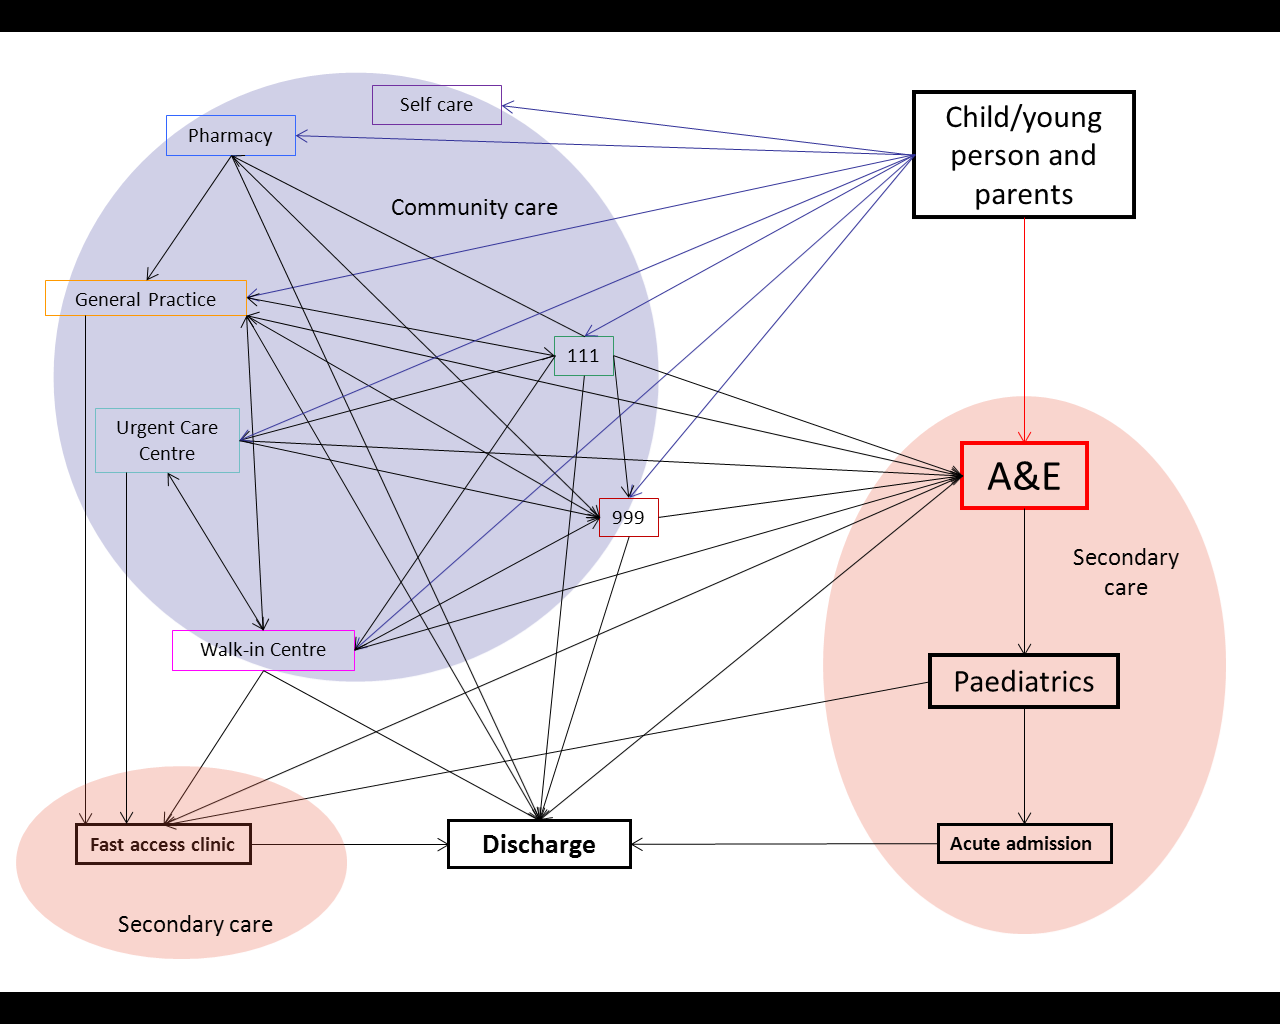
Figure 1 The different paediatric acute care pathways for Richmond
A&E and 999 are intended for life-threatening emergencies, such as:
- loss of consciousness
- acute confused state and fits that are not stopping
- breathing difficulties
- severe bleeding that cannot be stopped
The walk-in centre treats minor injuries and illnesses such as:
- Coughs and colds, urinary tract infections, earache and sore throats, headaches and rashes
- Cuts and bruises
- Strains and sprains – and possible fractures
- Superficial burns and scalds
- Wounds requiring stitching/closure
- Bites and stings
- Minor head injuries
- Tetanus immunisation if you need one following burns and lacerations
- Minor skin and tissue infections
- Removal of foreign bodies from eyes, ears and noses
- Emergency contraception
The urgent care centre similarly treats minor illnesses such as:
- Cuts and grazes
- Minor scalds and burns
- Strains and sprains
- Bites and stings
- Minor head injuries
- Ear and throat infections
- Minor skin infections / rashes
- Minor eye conditions / infections
- Stomach pains
- Suspected fractures
A broad range of acute and chronic medical conditions are treated in or referred from general practice. General practice is the first point of contact for many patients and provides access to other healthcare services, where appropriate.
Many pharmacists are able to offer advice on minor ailments, including aches and pains, skin conditions and stomach upsets. 111 is a service which advises patients on the appropriate course of action for a particular illness or symptom, when the caller does not think the situation is an emergency (in which case they should call 999).
2.3. Method
Quantitative approach
We have employed quantitative analysis to understand the pattern of use of paediatric acute care services. We have sought data on the:
- Number of GP consultations, urgent care centre attendances, A&E attendances and emergency admissions.
- Diagnoses or reasons for attendance
- Outcome of attendance at a service
Reference to the pattern of use across all acute care providers was used to allow a systems approach to understanding provision and use of services. For secondary acute care services, an outcome of discharge without follow-up or discharge to a primary care provider is used as a proxy measure to indicate patients that may have been more appropriately seen in the community setting. This does not imply that attendance is inappropriate, given current service provision.
Data collection
Data from 4 indicators from the national outcomes frameworks was used to compare the A&E attendances and hospital admissions by children and young people in Richmond to other boroughs in London and to the national average (Child Health Profile 2014 indicators 27(5), 28(5) and 30(5), and NHS Outcomes Framework indicator 2.3.ii).
We aimed to use data from all acute care providers in Table 1.
A&E attendances, emergency admissions and the Urgent Care centre attendances
Data on A&E attendances, emergency admissions and Urgent Care centre attendances have been collected from Secondary Uses Services (SUS) provided by the South West London Commissioning Support Unit (CSU).
This data was used to investigate the use over time, variation by GP practices and by geographical location and outcomes.
We were not able to use data on the reason for A&E or urgent care centre attendance or the diagnosis as the quality of data is poor and incomplete. Instead, information on the outcome of A&E attendance (e.g. discharge without treatment, referral to GP, or admission) and the treatment function (HRG) code. Diagnostic information ((ICD 10) was available for emergency admissions. A voidable emergency admissions were defined according to the Everybody Counts indicators “CB_A6_01: Unplanned hospitalisation for chronic ambulatory care sensitive conditions”, “CB_A6_03: Emergency admissions for acute conditions that should not usually require hospital admission”, “CB_A6_02: Unplanned hospitalisation for asthma, diabetes and epilepsy in under 19s”, and “CB_A6_04: Emergency admissions for children with Lower Respiratory Tract Infections (LRTI)” as specified in the technical guidance for 2013/14 (https://www.england.nhs.uk/everyonecounts/)
In the section on A&E attendances, attendances to emergency departments only were included, and attendances to walk-in centres, urgent care centres or minor injury units were excluded. The section on Urgent Care centres includes attendances to urgent care centres and minor injury units only.
GP consultations
Data for GP attendance and reasons for attendance were collected from read code data as extracted for risk stratification.
Other providers
There was no data available by age for NHS 111 and no data available for pharmacy consultations.
Qualitative approach
The aim of the qualitative approach is to identify the views and experiences of users and providers of acute paediatric care to inform plans for better management of minor illness among young children in the community.
We will use focus groups to achieve the key objectives of the qualitative approach, with prompts to guide discussion.
2.4. National comparison
There are several indicators from the national outcomes frameworks that measure A&E attendances and hospital admissions by children and young people. These allow us to compare the results for Richmond to other boroughs in London and to the national average.
The number of A&E attendances by children under 5 years (6,816 in 2011/12, 484 per 1,000 population) in Richmond is the lowest in London (as shown in Figure 2) and lower than the England average (511 per 1,000 population). This performance is also an improvement from the previous year (504 per 1,000 population).
Injuries (unintentional and deliberate) are a leading cause of hospitalisation and represent a major cause of premature mortality for children and young people. In 2012/13 there were 338 hospital admissions of Richmond children aged 0-14 years due to injury – 93 per 10,000 compared to 85 in London and 104 in England (see Figure 3). There were 182 hospital admissions of Richmond 15-24 year olds due to injury (104.1 per 10,000 compared to 101 in London and 131 in England).
Asthma is the commonest long-term medical condition in childhood. Emergency admissions should be avoided whenever possible. Richmond has significantly lower rates of emergency admissions for asthma for under-19 year olds than in London and England (see Figure 4). In 2012/13 the Richmond rate was 94 per 100,000 compared to 212 in London and 221.4 in England. This Richmond rate was the lowest of all London councils and equated to 41 admissions, with a reduction seen from the previous year.
Performance for unplanned admissions for asthma, diabetes and epilepsy in children aged 0-19 (see Figure 5) is mid-range compared to other London boroughs.
Despite these positive rankings these attendances are often avoidable and many could have been treated in primary care.
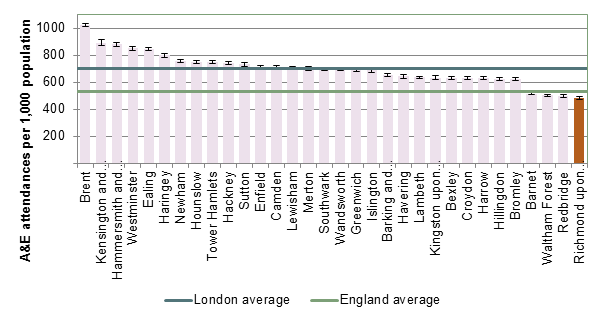
Figure 2 A&E attendance rate per 1,000 population aged 0-4 years, 2011/12
Source: Child Health Profile indicator 27(5) 2014
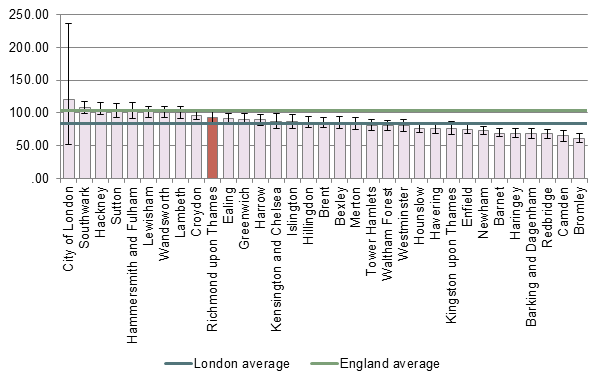 Figure 3 Hospital admissions cause by unintential and deliberated injuries in children aged 0-14 years, 2012/13,
Source: Child Health Profile indicator 28(5) 2014 & PH2.07i
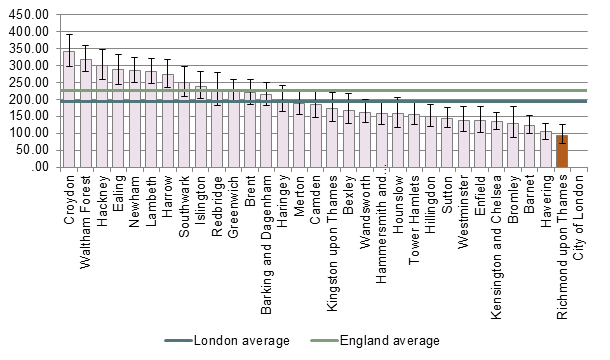 Figure 4 Hospital admissions for asthma in young persons aged 0-18 years, 2012/13,
Source: Child Health Profile indicator 30(5) 2014
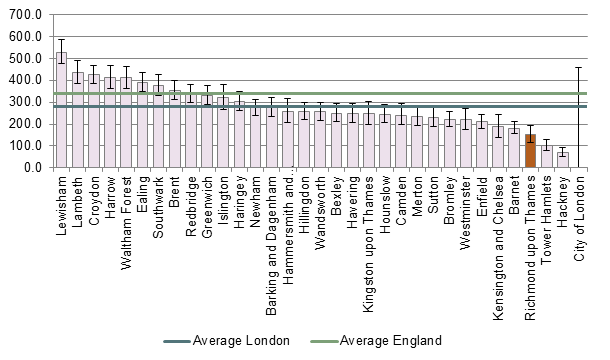
Figure 5 Unplanned admissions for asthma, diabetes, epilepsy in children, Source: NHS OF indicator 2.3.ii The number of finished and unfinished continuous inpatient spells (CIPS), excluding transfers, for children with an emergency method of admission and with p
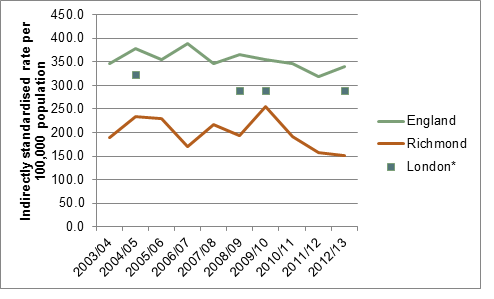
Figure 6 Trends unplanned admissions for respiratory, epilepsy and asthma, 2003/04 – 2012/13, *Data suppressed for some years due to small numbers, Source: NHS OF indicator 2.3.ii (as above)
3 Local Picture
3.1. A&E emergency departments
Number of A&E attendances
A breakdown of A&E attendances to emergency departments for all age groups is shown in Figure 7. The highest numbers attending A&E are those aged 0-4 years old. At 5,136 patients, the number of attendances in this age group is close to the total of 4,966 attendances for all those aged 5-19 in the same period. Within the 0-4 age group most attendances are for babies aged 0 or 1 (Figure 8).
Figure 9 shows that 36% of children aged 0-4 registered with a GP in Richmond attended A&E in 2013/14, compared to 14% of those aged 5-9 years, 13% of 10-14 years and 18% of 15-19 years[1]. Older people have the highest proportion of A&E attendances: 78% of people aged 85 years and older attended A&E in 2013/14.
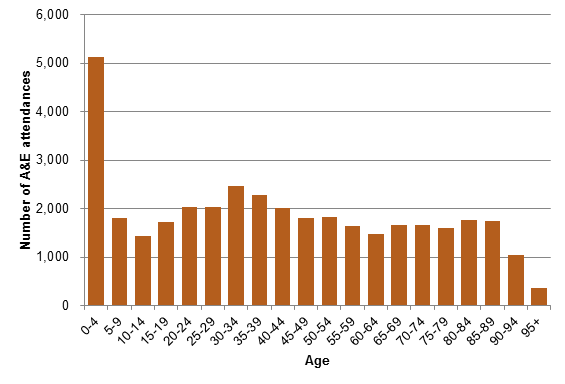
Figure 7 Number of A&E attendances by age group, Richmond CCG 2013/14
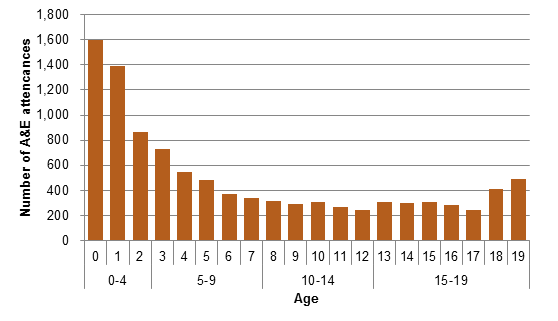
Figure 8 Number of A&E attendances by children and young people aged 0-19 by age, Richmond CCG 2013/14
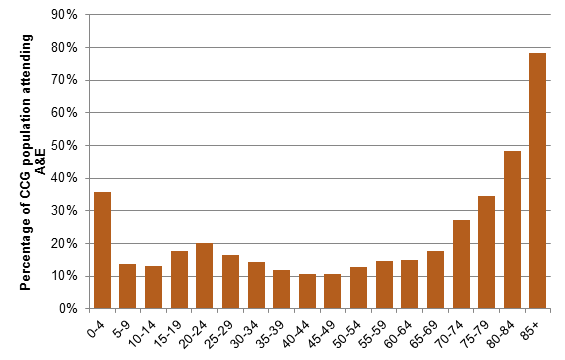
Figure 9 Percentage of CCG population attending A&E, 2013/14
Cost
The total cost of A&E attendances by children aged 0-4 years in 2013/14 was over £500,000. The total cost of A&E attendances by children and young people aged 0-19 years was over £1 million.
Table 1 Number and cost of A&E attendances by children and young people aged 0-19 years, 2013/14
|
Age Group |
Number of A&E attendances |
Percentage of total attendances |
Total Cost |
|
0-4 |
5,136 |
14% |
£512,672 |
|
5-9 |
1,804 |
5% |
£189,692 |
|
10-14 |
1,429 |
4% |
£157,633 |
|
15-19 |
1,733 |
5% |
£200,658 |
|
5-19 |
4,966 |
13% |
|
|
Total 0-19 |
10,102 |
27% |
£1,060,655 |
|
Total all ages |
37,546 |
|
|
Time trends
Figure 10 shows the number of Richmond residents aged 0-19 years old attending A&E over time. The number of A&E attendances by children aged 0-4 rose in 2010/11 and 2011/12; this was followed by a decline and the number of attendances has been stable from 2012/13. The number of attendances shows seasonal variation (i.e. a higher number of attendances in Quarter 3 than in Quarter 2) which is described further in Figure 12. Figure 11 shows the number of attendances as a proportion of the CCG population, taking into account any changes in population age. This also shows that the number of attendances has remained stable from 2012/13.
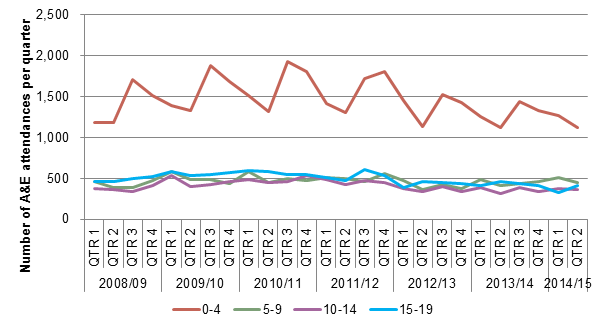
Figure 10 A&E attendance in children and young people, 2008/09- Quarter 2 2014/15
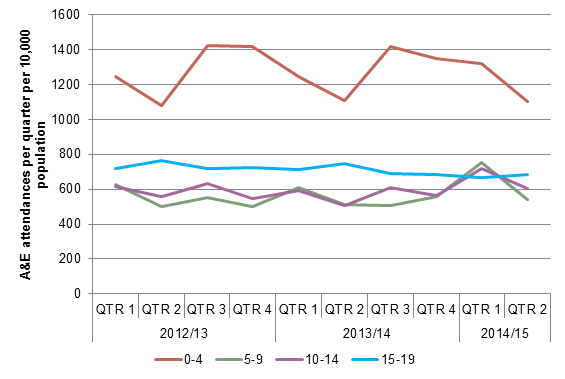
Figure 11 A&E attendance in children and young people as a proportion of the practice population, 2012/13- Quarter 2 2014/15
Seasonal variation
A lower number of A&E attendances by 0-19 year olds is seen during the summer holidays in August (Quarter 2) as shown in Figure 12 (and Figure 13 for those aged 0-4. years).
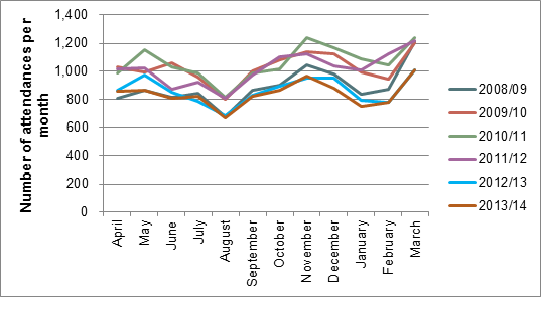
Figure 12 Number of A&E attendances by month in those aged 0-19 years old, 2008/9 to 2013/14
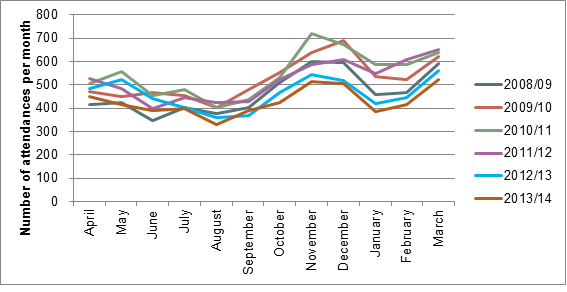
Figure 13 Number of A&E attendances by month in those aged 0-4 years old, 2008/9 to 2013/14
There are more attendances in A&E from Saturday to Monday than during the weekdays Tuesday to Thursday (Figure 14).The peak time of attendance in A&E for those aged 0-19 years old is 9am to 7pm (Figure 15). The lowest numbers attend from 3am to 7am. The sustained high attendance rate throughout the day until around 7pm contrasts with the pattern of attendance for adult age groups, where numbers tail off after around 10am.

Figure 14 Number of A&E attendances by weekday for those aged 0-19 years old, 2009/10 to 2013/14
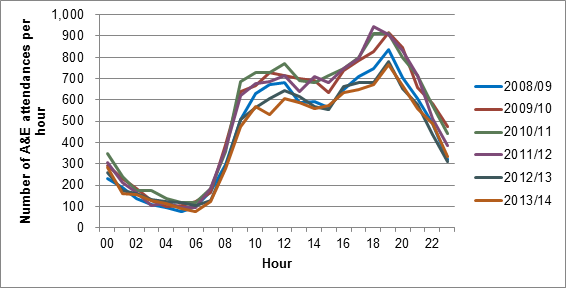
Figure 15 Number of A&E attendances by hour for those aged 0-19 years old 2008/09 to 2013/14
Geographical trends
There is a high degree of variability in attendance in A&E by general practice and by area, as shown in Figure 16. Teddington and Hampton and Twickenham and Whitton have the lowest rates of attendance in A&E and the highest rates are in East Sheen and Barnes. The majority of A&E attendances follow self-referral and only 5% of A&E attendances are referred by the GP.
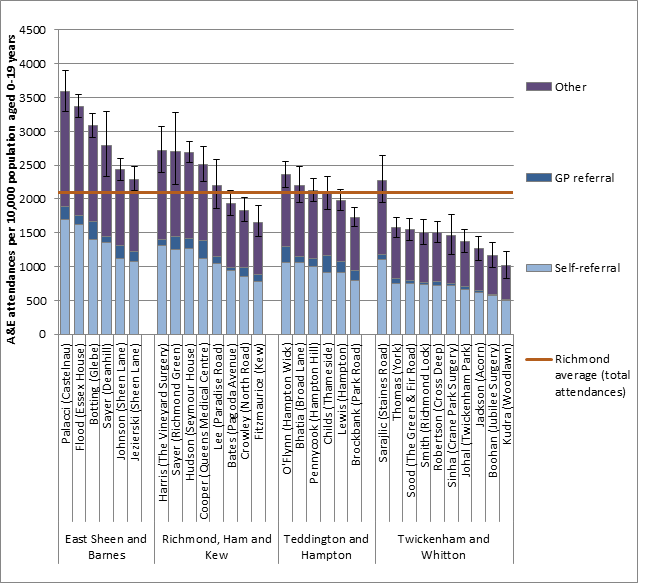
Figure 16 A&E attendances in those aged 0-19 years old per 10,000 by practice in each CCG network for 2013/14
The Other category includes referral by emergency services, other health care providers and other sources of referral. See Appendix A on page 64 for details.
There is a large degree of variation in the A&E provider attended according to the general practice patients are registered. This is related to the geographical distance to providers. Patients from practices in East Sheen and Barnes mostly attended Kingston Hospital (56% of attendances) and Chelsa and Westminster Hospital NHS Foundation Trust (26%); patients from practices in Richmond, Ham and Kew mostly Kingston Hospital NHS Trust (72%); patients from Teddington and Hampton mostly Kingston Hospital NHS Trust (72%), and; patients from Twickenham and Whitton mostly West Middlesex University Hospital NHS Trust (62%) and Kingston Hospital NHS Trust (21%) (see Table 2).
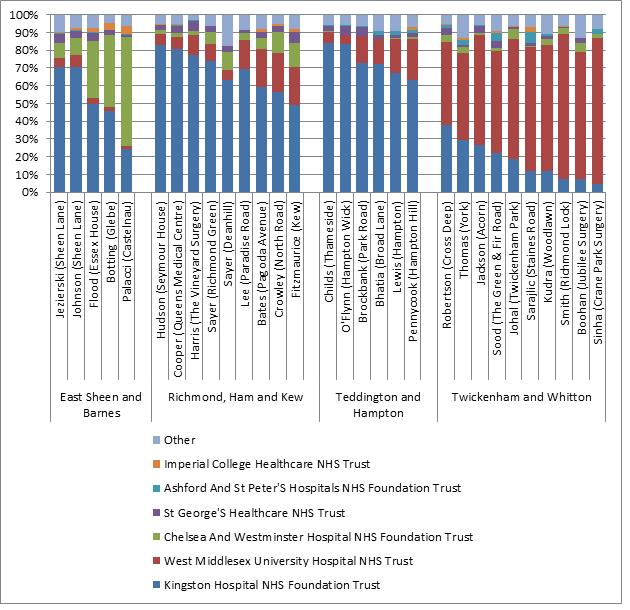
Figure 17 A&E attendances in those aged 0-19 years old by practice and provider in each CCG network, 2013/14
Table 2 A&E attendances in those aged 0-19 years old by practice and provider by CCG network, 2013/14
|
Clinical network |
Kingston Hospital NHS Foundation Trust |
West Middlesex University Hospital NHS Trust |
Chelsea And Westminster Hospital NHS Foundation Trust |
St George’s Healthcare NHS Trust |
Ashford And St Peter’s Hospitals NHS Foundation Trust |
Imperial College Healthcare NHS Trust |
Other |
|||||||
|
|
n |
% |
n |
% |
n |
% |
n |
% |
n |
% |
n |
% |
n |
% |
|
East Sheen and Barnes |
1,283 |
56% |
93 |
4% |
603 |
26% |
85 |
4% |
11 |
0% |
49 |
2% |
168 |
7% |
|
Richmond, Ham and Kew |
1,684 |
72% |
281 |
12% |
117 |
5% |
81 |
3% |
8 |
0% |
15 |
1% |
145 |
6% |
|
Teddington and Hampton |
1,836 |
72% |
384 |
15% |
14 |
1% |
83 |
3% |
31 |
1% |
10 |
0% |
185 |
7% |
|
Twickenham and Whitton |
576 |
21% |
1,742 |
62% |
87 |
3% |
62 |
2% |
59 |
2% |
19 |
1% |
240 |
9% |
|
Total |
5,379 |
54% |
2,500 |
25% |
821 |
8% |
311 |
3% |
109 |
1% |
93 |
1% |
738 |
7% |
Outcomes
A&E attendances by patients who were discharged without follow up treatment or with follow up by the general practitioner could possibly have been avoided. Figure 18 shows that, in 2013/14, 66% of children and young people aged 0-19 years old seen in A&E were discharged without follow up or discharged to general practice. Of the those attending A&E, 16% were admitted to a hospital bed (1627 admissions in 2013/14; 0-4: 18%, 5-9: 13%, 10-14: 13%; 15-19: 17%)
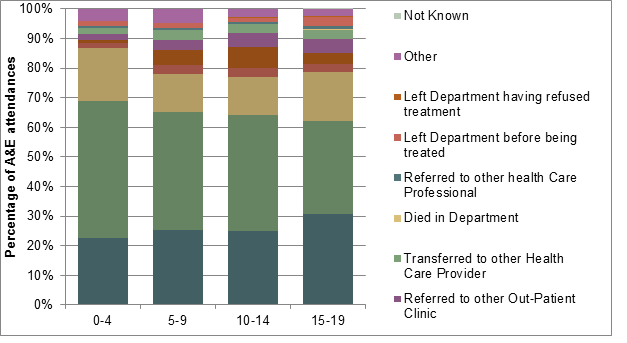
Figure 18 Outcome of A&E attendances in those aged 0-19 years old for Richmond upon Thames, 2013/14
Table 3 Cost by outcome of A&E attendances in those aged 0-19 years old for Richmond upon Thames, 2013/14
|
|
Age Group |
|||||||||
|
|
0-4 |
5-9 |
10-14 |
15-19 |
Total 0-19 |
|||||
|
AE Attendance Disposal Details |
Number |
Cost |
Number |
Cost |
Number |
Cost |
Number |
Cost |
Number |
Cost |
|
Admitted to a Hospital Bed /became a Lodged Patient of the same Health Care Provider |
925 |
£111,514 |
232 |
£28,900 |
184 |
£23,111 |
286 |
£37,827 |
1,627 |
£201,353 |
|
Discharged – follow up treatment to be provided by General Practitioner |
1,163 |
£113,376 |
455 |
£46,338 |
357 |
£39,046 |
530 |
£61,583 |
2,505 |
£260,344 |
|
Discharged – did not require any follow up treatment |
2,370 |
£223,224 |
720 |
£71,517 |
559 |
£59,149 |
541 |
£59,400 |
4,190 |
£413,291 |
|
Referred to A&E Clinic |
84 |
£9,602 |
52 |
£7,060 |
41 |
£5,169 |
47 |
£5,994 |
224 |
£27,824 |
|
Referred to Fracture Clinic |
58 |
£7,676 |
92 |
£11,794 |
103 |
£13,325 |
67 |
£8,980 |
320 |
£41,775 |
|
Referred to other Out-Patient Clinic |
94 |
£9,462 |
58 |
£6,367 |
65 |
£6,830 |
82 |
£9,781 |
299 |
£32,440 |
|
Transferred to other Health Care Provider |
115 |
£12,427 |
62 |
£7,145 |
47 |
£5,145 |
54 |
£6,086 |
278 |
£30,803 |
|
Died in Department |
|
|
1 |
£132 |
|
|
1 |
£142 |
2 |
£273 |
|
Referred to other health Care Professional |
21 |
£2,014 |
12 |
£1,152 |
7 |
£808 |
17 |
£2,176 |
57 |
£6,149 |
|
Left Department before being treated |
92 |
£7,676 |
28 |
£2,385 |
21 |
£1,680 |
56 |
£4,514 |
197 |
£16,256 |
|
Left Department having refused treatment |
1 |
£69 |
3 |
£289 |
2 |
£137 |
6 |
£519 |
12 |
£1,014 |
|
Other |
209 |
£15,173 |
85 |
£6,152 |
41 |
£2,969 |
37 |
£2,737 |
372 |
£27,030 |
|
Not Known |
|
|
|
|
|
|
3 |
£295 |
3 |
£295 |
|
Grand Total |
5,132 |
£512,212 |
1,800 |
£189,232 |
1,427 |
£157,369 |
1,726 |
£200,035 |
10,082 |
£1,058,848 |
Most children and young people aged 0-19 years old attending A&E received a category 1 investigation with category 1-2 treatment as shown in Figure 19. Investigations in this category include urinalysis, biochemistry and ECG and treatments include wound cleaning and closure, burns review, a splint or sling and prescription of medications to take away.
Those who have ‘no investigation with no significant treatment’ or who received a category 1 investigation with category 1-2 treatment again may indicate a group where A&E attendances could possibly have been avoided. For the 0-4 year old group, this constitutes 71% of patients (3,629 patients); for 15-19 year olds 43% (738 patients).

Figure 19 HRG coding of A&E attendance in those aged 0-19 years old for Richmond upon Thames, 2013/14
Table 4 Cost of A&E attendance by HRG coding in those aged 0-19 years old for Richmond upon Thames, 2013/14
|
|
Age Group |
|||||||||
|
|
0-4 |
5-9 |
10-14 |
15-19 |
Total 0-19 |
|||||
|
HRG Details |
Number |
Cost |
Number |
Cost |
Number |
Cost |
Number |
Cost |
Number |
Cost |
|
Data invalid for grouping |
9 |
£0 |
2 |
£0 |
3 |
£0 |
5 |
£0 |
19 |
£0 |
|
Any investigation with category 5 treatment |
4 |
£1,174 |
1 |
£282 |
2 |
£557 |
– |
– |
7 |
£2,014 |
|
Category 3 investigation with category 4 treatment |
3 |
£772 |
3 |
£807 |
3 |
£774 |
7 |
£1,798 |
16 |
£4,151 |
|
Category 3 investigation with category 1-3 treatment |
46 |
£9,091 |
42 |
£8,330 |
38 |
£7,547 |
68 |
£13,339 |
194 |
£38,306 |
|
Category 2 investigation with category 4 treatment |
74 |
£12,507 |
25 |
£4,329 |
20 |
£3,383 |
95 |
£15,729 |
214 |
£35,947 |
|
Category 2 investigation with category 3 treatment |
68 |
£10,661 |
23 |
£3,592 |
17 |
£2,543 |
24 |
£3,725 |
132 |
£20,521 |
|
Category 1 investigation with category 3-4 treatment |
232 |
£27,742 |
65 |
£7,823 |
32 |
£3,609 |
55 |
£6,452 |
384 |
£45,625 |
|
Category 2 investigation with category 2 treatment |
277 |
£39,450 |
176 |
£24,955 |
189 |
£26,809 |
230 |
£32,306 |
872 |
£123,520 |
|
Category 2 investigation with category 1 treatment |
789 |
£103,779 |
352 |
£45,966 |
390 |
£51,062 |
505 |
£65,924 |
2,036 |
£266,730 |
|
Category 1 investigation with category 1-2 treatment |
2,680 |
£242,594 |
808 |
£72,813 |
510 |
£46,319 |
492 |
£44,543 |
4,489 |
£406,269 |
|
Dental Care |
1 |
£69 |
– |
– |
1 |
£70 |
– |
– |
2 |
£139 |
|
No investigation with no significant treatment |
949 |
£64,371 |
303 |
£20,334 |
222 |
£14,698 |
246 |
£16,221 |
1,719 |
£115,625 |
|
Grand Total |
5,132 |
£512,212 |
1,800 |
£189,232 |
1,427 |
£157,369 |
1,726 |
£200,035 |
10,082 |
£1,058,848 |
Deprivation
A significantly higher proportion of those living in the most deprived areas in Richmond attended A&E in 2013/14 compared to less deprived areas. For example, 61% of children aged 0-4 living in the most deprived quintile attended A&E, compared to 47% of those living in the least deprived quintile. This is shown in Figure 20 and Table 5. The proportions of A&E attendances in the other 4 deprivation quintiles are mostly not significantly different from each other.
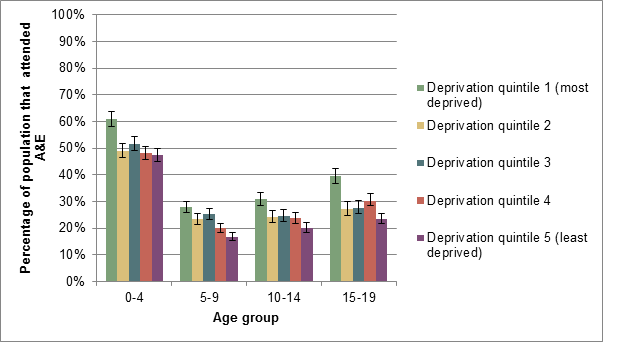
Figure 20 Number of A&E attendances as a proportion of the population by IMD 2011 deprivation quintile and age group with 95% confidence intervals, London Borough of Richmond upon Thames[2] 2013/14
Table 5 Number of A&E attendances as a proportion of the population by IMD 2011 deprivation quintile and age group, London borough of Richmond upon Thames 2013/14
|
|
Age group |
|
|
|
|
|
|
|
|
|
|
|
|
0-4 |
|
|
5-9 |
|
|
10-14 |
|
|
15-19 |
|
|
|
|
Deprivation quintile |
Attendances |
Population |
% |
Attendances |
Population |
% |
Attendances |
Population |
% |
Attendances |
Population |
% |
|
1 (most deprived) |
1751 |
2867 |
61% |
741 |
2652 |
28% |
642 |
2081 |
31% |
767 |
1936 |
40% |
|
2 |
1490 |
3034 |
49% |
547 |
2329 |
23% |
462 |
1894 |
24% |
450 |
1646 |
27% |
|
3 |
1401 |
2711 |
52% |
568 |
2253 |
25% |
489 |
1983 |
25% |
433 |
1568 |
28% |
|
4 |
1494 |
3099 |
48% |
515 |
2562 |
20% |
477 |
2006 |
24% |
481 |
1588 |
30% |
|
5 (least deprived) |
1326 |
2798 |
47% |
446 |
2640 |
17% |
460 |
2273 |
20% |
536 |
2272 |
24% |
|
Total |
7462 |
14509 |
51% |
2817 |
12436 |
23% |
2530 |
10237 |
25% |
2667 |
9010 |
30% |
3.2. Emergency admissions
Number of emergency admissions
One outcome of A&E attendance is emergency admission to hospital. As shown in Figure 18, this happens in 17% in admissions by age 0-4, 11% of age 5-9, 9% of age 10-14 and 14% of age 15-19. There is variation in emergency admission rates between GP practices as shown in Figure 21.
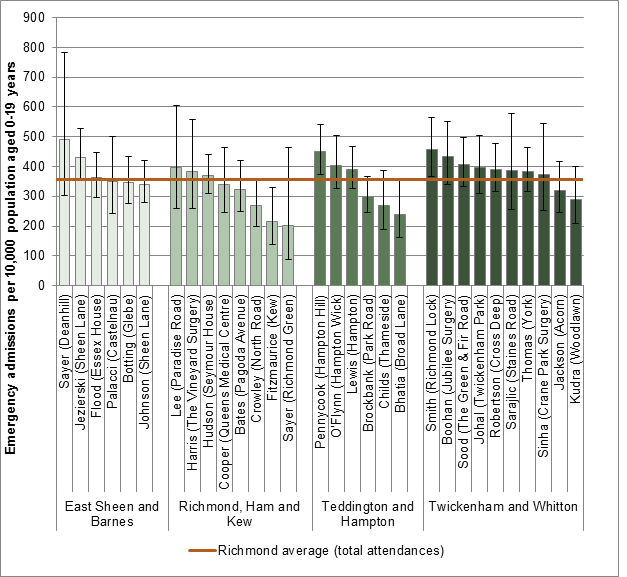
Figure 21 Numbers of emergency admissions per 10,000 for those aged 0-19 years of age by general practice and CCG network, 2013/14
In most age groups, the majority of emergency admissions are for males. The exception is 15-19 year olds, where the majority of emergency admissions are in females – see Figure 22.
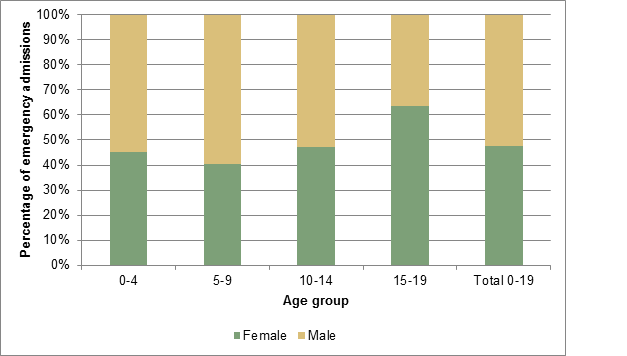
Figure 22 Emergency admissions in those aged 0-19 years by sex and age group, 2013/14
Cost
The total cost of emergency admissions by children aged 0-4 years in 2013/14 was over £1.1 million (Table 6). The total cost of emergency admissions by children and young people aged 0-19 years was over £2.3 million.
Table 6 Number and cost of emergency admissions by children and young people aged 0-19 years, 2013/14
|
Age Group |
Emergency admissions |
Total Cost |
|
0-4 |
990 |
£1,177,658 |
|
5-9 |
314 |
£485,192 |
|
10-14 |
203 |
£309,915 |
|
15-19 |
275 |
£388,804 |
|
Total |
1,782 |
£2,361,569 |
Time trends
The number of emergency admissions has remained stable over the last 6 years as shown in Figure 23.
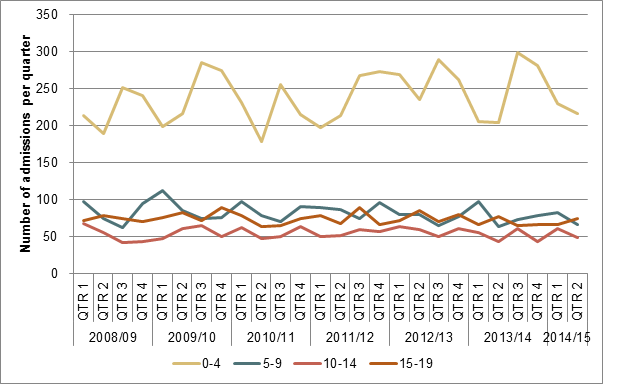
Figure 23 Number of emergency admissions by children and young people aged 0-19 years over time, 2008/09 – Quarter 2 2014/15
Deprivation
The number of emergency admissions is not significantly different between deprivation quintiles, see Figure 24 and Table 7.
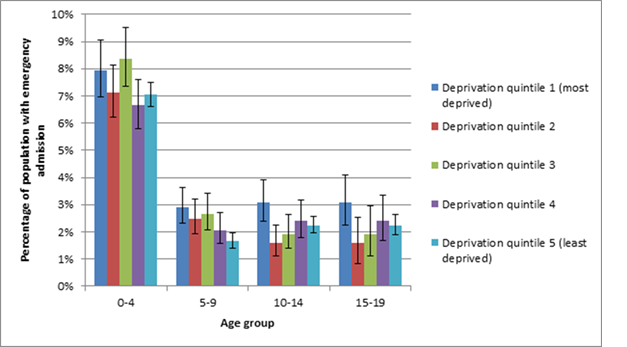
Figure 24 Number of emergency admissions as a proportion of the population by IMD 2011 deprivation quintile and age group with 95% confidence intervals, London Borough of Richmond upon Thames[3] 2013/14
Table 7 Number of emergency admissions as a proportion of the population by IMD 2011 deprivation quintile and age group with 95% confidence intervals, London Borough of Richmond upon Thames 2013/14
|
|
Age group |
|||||||||||
|
0-4 |
5-9 |
10-14 |
15-19 |
|||||||||
|
Deprivation quintile |
Admissions |
Population |
% |
Admissions |
Population |
% |
Admissions |
Population |
% |
Admissions |
Population |
% |
|
1 (most deprived) |
228 |
2867 |
8% |
77 |
2652 |
3% |
64 |
2081 |
3% |
82 |
1936 |
3% |
|
2 |
216 |
3034 |
7% |
58 |
2329 |
2% |
30 |
1894 |
2% |
50 |
1646 |
2% |
|
3 |
227 |
2711 |
8% |
60 |
2253 |
3% |
38 |
1983 |
2% |
55 |
1568 |
2% |
|
4 |
206 |
3099 |
7% |
53 |
2562 |
2% |
48 |
2006 |
2% |
44 |
1588 |
2% |
|
5 (least deprived) |
197 |
2798 |
7% |
44 |
2640 |
2% |
51 |
2273 |
2% |
50 |
2272 |
2% |
|
Grand Total |
1074 |
14509 |
7% |
292 |
12436 |
2% |
231 |
10237 |
2% |
281 |
9010 |
2% |
Avoidable admissions
Some admissions could be avoided by primary prevention or community-based interventions[4].
Table 8 shows the number of avoidable emergency admissions by condition for children and young people.
|
|
Total emergency admissions |
Avoidable emergency admissions |
||||
|
Age Group |
Number |
Cost |
Number |
% |
Cost |
% |
|
0-4 |
990 |
£1,177,658 |
266 |
27% |
£281,629 |
24% |
|
5-9 |
314 |
£485,192 |
65 |
21% |
£62,471 |
13% |
|
10-14 |
203 |
£309,915 |
25 |
12% |
£26,994 |
9% |
|
15-19 |
275 |
£388,804 |
39 |
14% |
£42,365 |
11% |
|
Total |
1,782 |
£2,361,569 |
395 |
22% |
£413,459 |
18% |
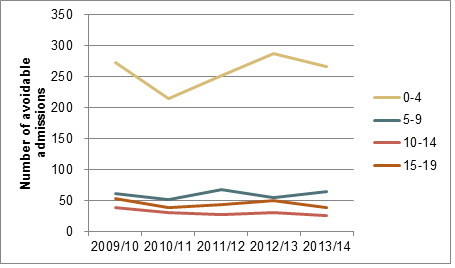
Figure 25 Number of avoidable admissions in children and young people over time, 2009/10 – 2013/14
Table 9 Number and cost of avoidable emergency admissions by condition
|
Condition |
0-4 |
|
5-9 |
|
10-14 |
|
15-19 |
|
Total 0-19
|
|
|
Number |
Cost |
Number |
Cost |
Number |
Cost |
Number |
Cost |
Number |
Cost |
|
|
Acute Conditions |
||||||||||
|
Cellulitis |
1 |
£1,646 |
1 |
£937 |
2 |
£2,583 |
||||
|
Convulsions and epilepsy |
13 |
£9,738 |
5 |
£3,478 |
2 |
£1,371 |
1 |
£687 |
21 |
£15,274 |
|
Dehydration and gastroenteritis |
49 |
£40,192 |
5 |
£4,650 |
4 |
£3,080 |
5 |
£5,387 |
63 |
£53,309 |
|
Dental conditions |
1 |
£429 |
5 |
£2,812 |
6 |
£3,241 |
||||
|
Ear nose and throat infections |
57 |
£39,894 |
15 |
£13,076 |
2 |
£1,269 |
9 |
£6,555 |
83 |
£60,794 |
|
Influenza Pneumonia |
14 |
£28,281 |
2 |
£4,154 |
2 |
£4,058 |
18 |
£36,493 |
||
|
Perforated or bleeding ulcer |
12 |
£9,716 |
0 |
0 |
0 |
12 |
£9,716 |
|||
|
Pyelonephritis and kidney or urinary tract infections |
14 |
£20,082 |
5 |
£7,303 |
9 |
£9,723 |
28 |
£37,108 |
||
|
Total |
160 |
£148,332 |
38 |
£37,119 |
9 |
£6,657 |
26 |
£26,410 |
233 |
£218,518 |
|
Chronic conditions |
13 |
£12,509 |
23 |
£20,591 |
13 |
£14,334 |
9 |
£8,733 |
58 |
£56,167 |
|
Asthma |
5 |
£4,276 |
16 |
£12,628 |
7 |
£6,015 |
5 |
£3,956 |
33 |
£26,875 |
|
Convulsions and epilepsy |
8 |
£8,233 |
3 |
£3,424 |
3 |
£4,954 |
1 |
£1,329 |
15 |
£17,940 |
|
Diabetes |
0 |
4 |
£4,539 |
3 |
£3,365 |
4 |
£4,621 |
11 |
£12,525 |
|
|
Hypertension |
0 |
0 |
1 |
£1,625 |
0 |
1 |
£1,625 |
|||
|
Iron deficiency anaemia |
0 |
1 |
£1,607 |
1 |
£3,130 |
1 |
£3,146 |
3 |
£7,883 |
|
|
Total |
13 |
£12,509 |
24 |
£22,198 |
15 |
£19,089 |
11 |
£13,052 |
63 |
£66,848 |
|
Lower Respiratory Tract Infection |
||||||||||
|
Lower Respiratory Tract Infection Total |
107 |
£149,069 |
5 |
£7,308 |
1 |
£1,248 |
4 |
£6,961 |
117 |
£164,586 |
|
Total |
266 |
£281,629 |
65 |
£62,471 |
25 |
£26,994 |
39 |
£42,365 |
395 |
£413,459 |
Diagnosis
0-4 years
The majority of emergency admissions for those aged 0-4 years are for diseases of the respiratory tract and certain infections and parasitic diseases, see Figure 26. Other common diagnoses include symptoms and abnormal findings not classified elsewhere, poisoning and certain other consequences of external causes; certain conditions originating in the perinatal period; and diseases of the digestive system. These 6 diagnosis groups together account for over three-quarters of emergency admissions in the 0-4 year age group.
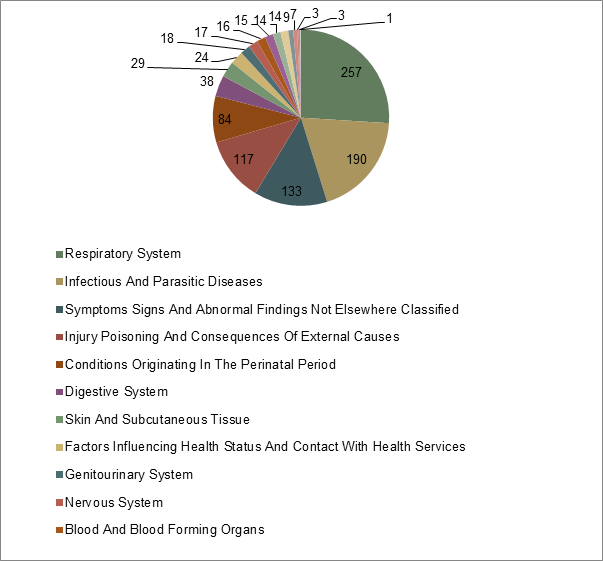
Figure 26 Diagnoses (ICD codes) of emergency admissions in those aged 0-4 years, 2013/14
The diagnosis group respiratory diseases mostly includes admissions for acute bronchiolitis, unspecified lower respiratory tract infection and pneumonia of unspecified organism as shown in Figure 27. The vast majority of admissions for infectious and parasitic causes were viral infections of unspecified site.
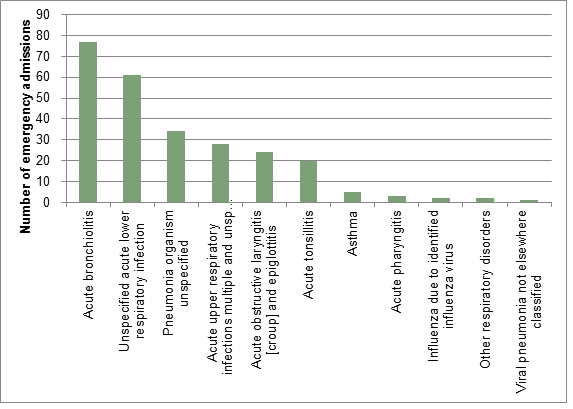
Figure 27 Emergency admissions for respiratory disease in children aged 0-4 years, 2013/14
5-9 years
For those aged 5-9 years of age, the largest group of emergency admissions was for injury, poisoning and certain other consequences of external cause. Other common causes of admissions in this age group are symptoms, signs and abnormal clinical and laboratory findings not elsewhere classified; diseases of the respiratory system; certain infectious and parasitic diseases; and diseases of the digestive, as shown in Figure 28.
The majority of admissions in the injury, poisoning and certain other consequences of external cause were accounted for by fractures of the forearm; open wound to the head; open wound to the wrist or hand; and fractures of the shoulder or upper arm. For emergency admission due to respiratory disease, the largest categories were asthma, unspecified acute lower respiratory tract infection/pneumonia of unspecified organism and acute tonsillitis.
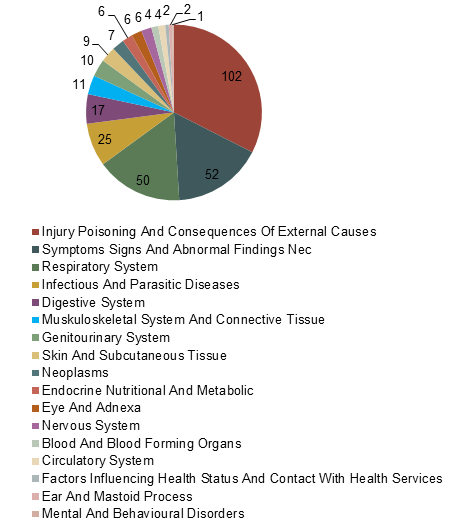
Figure 28 Diagnoses (ICD codes) of emergency admissions in those aged 5-9 years, 2013/14
10-14 years
For those aged 10-14 years of age, the majority reason for emergency admission is, similarly to those aged 5-9 years, injury, poisoning and certain other consequences of external cause, see Figure 29. The next most common diagnostic categories used for emergency admission are symptoms, signs and abnormal clinical and laboratory findings, not elsewhere classified; diseases of the digestive system; diseases of the respiratory system and certain endocrine, nutritional and metabolic diseases. These 5 categories together constitute over three-quarters of emergency admissions.
The major group for the injuries category is fracture of the forearm. The vast majority of emergency admissions for ‘diseases of the digestive system’ are accounted for by acute appendicitis.
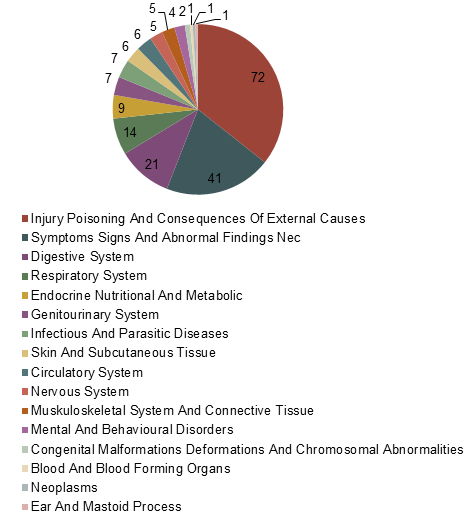
Figure 29 Diagnoses (ICD codes) of emergency admissions in those aged 10-14 years, 2013/14
15-19 years
For those aged 15-19 years, the largest single cause of emergency admission is injury, poisoning and certain consequences of external cause (see Figure 30) as for those aged 5-9 years and 10-14 years. For this age group, however, the largest single subcategory within this is poisoning by non-opioid analgesic, anti-pyretic and anti-rheumatic. The next largest group is symptoms, signs and abnormal clinical and laboratory findings, not elsewhere classified. The largest single subcategory within this is abdominal and pelvic pain (otherwise unspecified). Other major causes of emergency admission include diseases of the digestive system, diseases of the respiratory system and diseases of the genitourinary system.
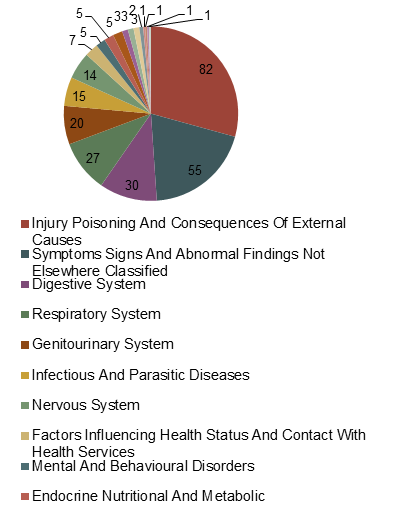
Figure 30 Diagnoses (ICD codes) of emergency admissions in those aged 15-19 years, 2013/14
3.3. Urgent Care Centres
There are three urgent care centres/minor injury units that are regularly attended by Richmond patients: Hounslow and Richmond Community Health Care NHS Trust, St George’s Healthcare NHS trust and Imperial College Healthcare NHS trust.
The highest number of attendances to an urgent care centre or minor injury unit are in Twickenham and Whitton to HRCH 2,442, this network accounts for 52% of all urgent care centre attendances.
HRCH is also attended by residents from Richmond, Ham and Kew (506 attendances, 60%) and Teddington and Hampton (406 attendances, 88%), but patients from East Sheen and Barnes are more likely to attend the urgent care centres at St George’s healthcare trust (783 attendances, 75%).
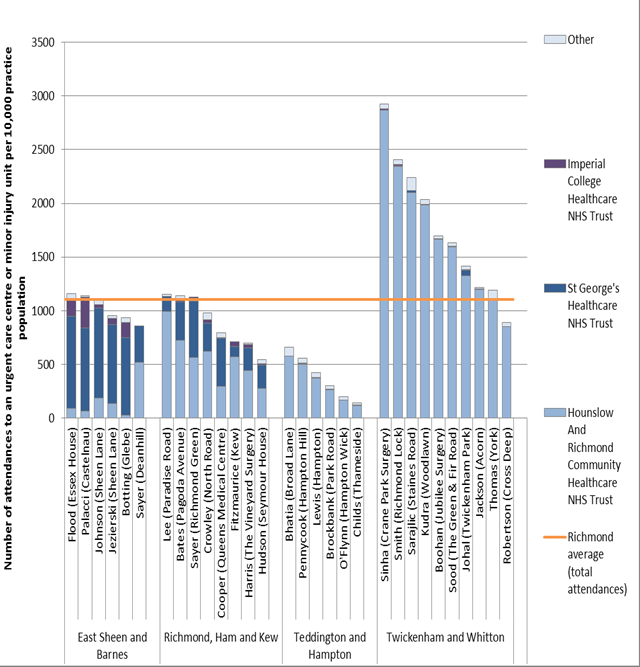
Figure 31 shows the number of attendances to an urgent care centre of minor injury unit by GP practice
Table 10 Number of attendances to an urgent care centre or minor injury unit, 2013/14
|
|
Hounslow And Richmond Community Healthcare NHS Trust |
St George’s Healthcare NHS Trust |
Imperial College Healthcare NHS Trust |
Other |
Total |
|||||
|
|
Number |
% of network total |
Number |
% of network total |
Number |
% of network total |
Number |
% of network total |
Number |
% of total by network |
|
East Sheen and Barnes |
109 |
10% |
783 |
75% |
110 |
11% |
40 |
4% |
1,043 |
21% |
|
Richmond, Ham and Kew |
506 |
60% |
276 |
33% |
21 |
3% |
35 |
4% |
839 |
17% |
|
Teddington and Hampton |
406 |
88% |
6 |
1% |
3 |
1% |
48 |
10% |
464 |
9% |
|
Twickenham and Whitton |
2,442 |
96% |
13 |
1% |
9 |
0% |
71 |
3% |
2,536 |
52% |
|
Total |
3,463 |
71% |
1,078 |
22% |
143 |
3% |
194 |
4% |
4,879 |
100% |
Figure 31 Number of attendances to an urgent care unit or minor injury unit by children and young people aged 0-19 years per 10,000 practice population by provider, 2013/14
Figure 32 shows the increase in the number of attendances to HRCH urgent care centre. Activity in the other urgent care centres has remained stable.

Figure 32 Number of attendances to an urgent care centre or minor injury unit for children and young people aged 0-19, Richmond CCG 2009/10-2013/14
The opening of Hounslow Urgent Care Centre particularly had an impact on attendance in A&E at West Middlesex University Hospital – see Figure 33. These two services are offered on the same site, which helps to explain this impact. Reduction in A&E attendance at other providers was not seen.
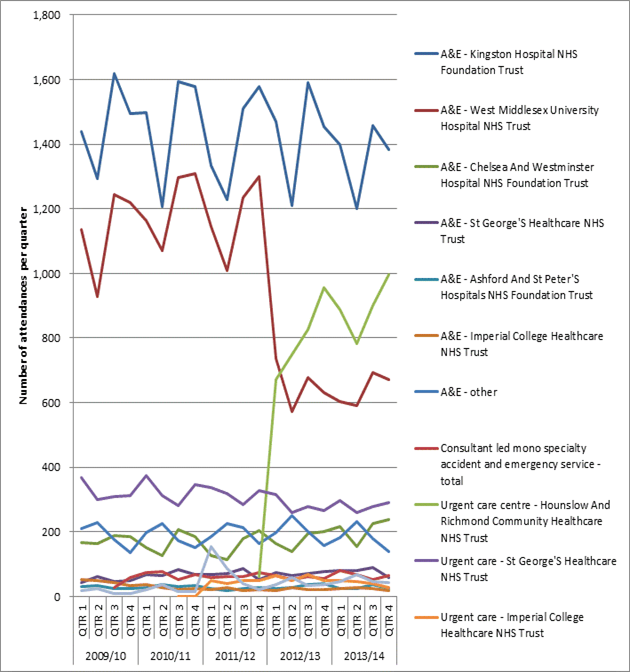
Figure 33 Change in number of attendances for those aged 0-19 years over time for A&E providers and urgent care centres from 2008/09 to 2013/14
Table 11 Number of attendances by provider per quarter, children and young people aged 0-19, 2009/10 – 2013/14
|
Emergency departments |
Consultant led mono specialty accident and emergency service |
Other type of A&E/minor injury |
|||||||||||
|
Year |
Quarter |
Kingston Hospital NHS Foundation Trust |
West Middlesex University Hospital NHS Trust |
Chelsea And Westminster Hospital NHS Foundation Trust |
St George’s Healthcare NHS Trust |
Ashford And St Peter’s Hospitals NHS Foundation Trust |
Imperial College Healthcare NHS Trust |
Other |
Total |
Hounslow And Richmond Community Healthcare NHS Trust |
St George’S Healthcare NHS Trust |
Imperial College Healthcare NHS Trust |
Urgent care – Other |
|
2009/10 |
QTR 1 |
1,439 |
1,135 |
167 |
44 |
31 |
53 |
210 |
12 |
367 |
18 |
||
|
QTR 2 |
1,294 |
928 |
164 |
61 |
33 |
50 |
230 |
0 |
299 |
24 |
|||
|
QTR 3 |
1,618 |
1,244 |
189 |
48 |
25 |
44 |
176 |
28 |
310 |
9 |
|||
|
QTR 4 |
1,495 |
1,220 |
185 |
51 |
26 |
35 |
135 |
58 |
312 |
9 |
|||
|
2010/11 |
QTR 1 |
1,498 |
1,165 |
151 |
67 |
27 |
37 |
198 |
75 |
375 |
23 |
||
|
QTR 2 |
1,208 |
1,071 |
128 |
65 |
38 |
27 |
225 |
76 |
312 |
36 |
|||
|
QTR 3 |
1,594 |
1,297 |
207 |
85 |
32 |
21 |
172 |
52 |
283 |
1 |
15 |
||
|
QTR 4 |
1,577 |
1,308 |
186 |
67 |
33 |
24 |
153 |
68 |
348 |
1 |
14 |
||
|
2011/12 |
QTR 1 |
1,334 |
1,144 |
126 |
69 |
26 |
23 |
186 |
60 |
336 |
49 |
156 |
|
|
QTR 2 |
1,227 |
1,009 |
114 |
71 |
20 |
29 |
226 |
62 |
318 |
41 |
87 |
||
|
QTR 3 |
1,510 |
1,235 |
178 |
86 |
26 |
19 |
213 |
62 |
285 |
49 |
40 |
||
|
QTR 4 |
1,577 |
1,301 |
203 |
54 |
27 |
22 |
165 |
75 |
62 |
329 |
50 |
22 |
|
|
2012/13 |
QTR 1 |
1,469 |
736 |
163 |
74 |
26 |
19 |
198 |
64 |
671 |
316 |
64 |
38 |
|
QTR 2 |
1,211 |
571 |
140 |
66 |
29 |
27 |
252 |
54 |
748 |
259 |
51 |
59 |
|
|
QTR 3 |
1,591 |
677 |
196 |
71 |
38 |
22 |
202 |
61 |
825 |
277 |
69 |
34 |
|
|
QTR 4 |
1,454 |
631 |
201 |
76 |
39 |
22 |
158 |
56 |
955 |
267 |
50 |
38 |
|
|
2013/14 |
QTR 1 |
1,399 |
602 |
218 |
81 |
24 |
25 |
184 |
80 |
889 |
296 |
51 |
46 |
|
QTR 2 |
1,200 |
592 |
154 |
82 |
24 |
27 |
232 |
67 |
784 |
259 |
47 |
68 |
|
|
QTR 3 |
1,456 |
694 |
225 |
89 |
38 |
25 |
179 |
54 |
901 |
279 |
39 |
47 |
|
|
QTR 4 |
1,384 |
673 |
237 |
60 |
25 |
19 |
138 |
66 |
996 |
292 |
28 |
42 |
|
Cost
Table 12 Cost of attendances to an urgent care centre or minor injury unit by age and provider, 2013/14
|
Provider |
0-4 |
|
5-9 |
|
10-14 |
|
15-19 |
|
Total 0-19 |
|
|
Number |
Cost |
Number |
Cost |
Number |
Cost |
Number |
Cost |
Number |
Cost |
|
|
Emergency departments |
|
|
|
|
|
|
|
|
|
|
|
Kingston Hospital NHS Foundation Trust |
2,749 |
£274,695 |
1,045 |
£108,738 |
828 |
£91,299 |
817 |
£91,307 |
5,439 |
£566,039 |
|
West Middlesex University Hospital NHS Trust |
1,502 |
£155,278 |
355 |
£40,262 |
278 |
£31,991 |
426 |
£53,706 |
2,561 |
£281,237 |
|
Chelsea And Westminster Hospital NHS Foundation Trust |
458 |
£44,825 |
202 |
£20,810 |
101 |
£10,729 |
73 |
£7,732 |
834 |
£84,096 |
|
St George’S Healthcare NHS Trust |
96 |
£7,615 |
58 |
£5,398 |
78 |
£8,030 |
80 |
£9,575 |
312 |
£30,618 |
|
Ashford And St Peter’S Hospitals NHS Foundation Trust |
42 |
£4,540 |
16 |
£1,444 |
28 |
£3,338 |
25 |
£2,948 |
111 |
£12,270 |
|
Imperial College Healthcare NHS Trust |
21 |
£1,935 |
4 |
£559 |
7 |
£1,053 |
64 |
£8,892 |
96 |
£12,438 |
|
Other |
264 |
23,324 |
120 |
12,022 |
107 |
10,928 |
242 |
25,875 |
731 |
72,150 |
|
Total |
5,132 |
£512,212 |
1,800 |
£189,232 |
1,427 |
£157,369 |
1,726 |
£200,035 |
10,082 |
£1,058,848 |
|
Other type of A&E/minor injury |
|
|
|
|
|
|
|
|
|
|
|
RY9 – Hounslow And Richmond Community Healthcare NHS Trust |
1,895 |
£127,389 |
627 |
£42,149 |
485 |
£32,604 |
563 |
£37,847 |
3,570 |
£239,989 |
|
RJ7 – St George’S Healthcare NHS Trust |
156 |
£10,850 |
304 |
£21,079 |
411 |
£28,774 |
251 |
£17,647 |
1,122 |
£78,350 |
|
RYJ – Imperial College Healthcare NHS Trust |
47 |
£3,327 |
22 |
£1,557 |
21 |
£1,486 |
75 |
£5,308 |
165 |
£11,678 |
|
Other |
64 |
4,478 |
40 |
2,587 |
45 |
3,144 |
57 |
4,446 |
203 |
14,655 |
|
Total |
2,162 |
£146,044 |
993 |
£67,372 |
962 |
£66,008 |
946 |
£65,249 |
5,060 |
£344,673 |
Outcomes
The majority of attendance at Hounslow Urgent Care Centre results in discharge without further follow-up or discharge to the general practitioner (from around 70% to over 80% depending on the age group). A larger proportion of 15-19 year olds are referred to A&E than for other age groups, and this is still only 4% of attendances. Those attending who are 10-14 years of age are much more likely to be referred onto fracture clinic (15% of total attendances for this age group), see Figure 34.
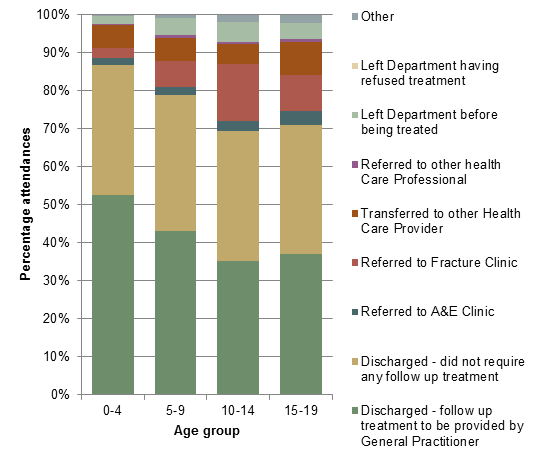
Figure 34 Outcome of attendance at Hounslow Urgent Care Centre by onward referral by age group, 2013/14
Table 13 Outcome of attendance at Hounslow Urgent Care Centre by onward referral by age group, 2013/14
|
|
Age group |
|||||||||
|
|
0-4 |
|
5-9 |
|
10-14 |
|
15-19 |
Total 0-19 |
||
|
Discharged – follow up treatment to be provided by General Practitioner |
996 |
53% |
271 |
43% |
171 |
35% |
209 |
37% |
1,647 |
46% |
|
Discharged – did not require any follow up treatment |
646 |
34% |
224 |
36% |
166 |
34% |
190 |
34% |
1,226 |
34% |
|
Referred to A&E Clinic |
38 |
2% |
13 |
2% |
12 |
2% |
21 |
4% |
84 |
2% |
|
Referred to Fracture Clinic |
49 |
3% |
42 |
7% |
73 |
15% |
53 |
9% |
217 |
6% |
|
Transferred to other Health Care Provider |
115 |
6% |
39 |
6% |
26 |
5% |
50 |
9% |
230 |
6% |
|
Referred to other health Care Professional |
3 |
0% |
5 |
1% |
2 |
0% |
4 |
1% |
14 |
0% |
|
Left Department before being treated |
43 |
2% |
27 |
4% |
26 |
5% |
24 |
4% |
120 |
3% |
|
Left Department having refused treatment |
0 |
0% |
1 |
0% |
0 |
0% |
0 |
0% |
1 |
0% |
|
Other |
5 |
0% |
5 |
1% |
9 |
2% |
12 |
2% |
31 |
1% |
|
Total |
1,895 |
|
627 |
|
485 |
|
563 |
|
3,570 |
|
A further outcome of attendance is the level of investigation and treatment which is received. Figure 35 shows a breakdown of categories of investigation and treatment by age group. The single largest category for all age groups is category 1 investigation with category 1-2 treatment. Investigations in this category include urinalysis, biochemistry and ECG and treatments include wound cleaning and closure, burns review, a splint or sling and prescription of medications to take away. The second largest category for all age groups is no investigation and no significant treatment. The third largest, particularly significant for the 10-14 age group is category 2 investigation with category 1 treatment. This group includes investigation with x-ray.
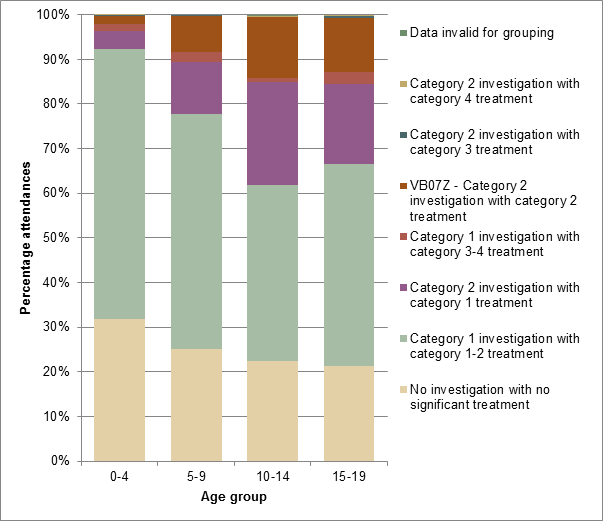
Figure 35 Outcome of attendance at Hounslow Urgent Care Centre by category of investigation and treatment for each age group in Richmond upon Thames, 2013/14
Table 14 Outcome of attendance at Hounslow Urgent Care Centre by category of investigation and treatment for each age group in Richmond upon Thames, 2013/14
|
|
Age group |
|
|
|
|
|
|
|
|
||
|
|
0-4 |
|
5-9 |
|
10-14 |
|
15-19 |
Total 0-19 |
|||
|
Data invalid for grouping |
0 |
0% |
0 |
0% |
1 |
0% |
0 |
0% |
1 |
0% |
|
|
No investigation with no significant treatment |
602 |
32% |
158 |
25% |
109 |
22% |
120 |
21% |
989 |
28% |
|
|
Category 1 investigation with category 1-2 treatment |
1,147 |
61% |
329 |
52% |
191 |
39% |
255 |
45% |
1,922 |
54% |
|
|
Category 2 investigation with category 1 treatment |
75 |
4% |
74 |
12% |
112 |
23% |
100 |
18% |
361 |
10% |
|
|
VB07Z – Category 2 investigation with category 2 treatment |
33 |
2% |
51 |
8% |
66 |
14% |
68 |
12% |
218 |
6% |
|
|
Category 1 investigation with category 3-4 treatment |
33 |
2% |
13 |
2% |
4 |
1% |
16 |
3% |
66 |
2% |
|
|
Category 2 investigation with category 3 treatment |
3 |
0% |
2 |
0% |
1 |
0% |
2 |
0% |
8 |
0% |
|
|
Category 2 investigation with category 4 treatment |
2 |
0% |
|
0% |
1 |
0% |
2 |
0% |
5 |
0% |
|
|
Grand Total |
1,895 |
|
627 |
|
485 |
|
563 |
|
3,570 |
|
|
3.4. General Practice
Throughput
The majority of attendances in general practice are again for 0-4 year olds, see Figure 36.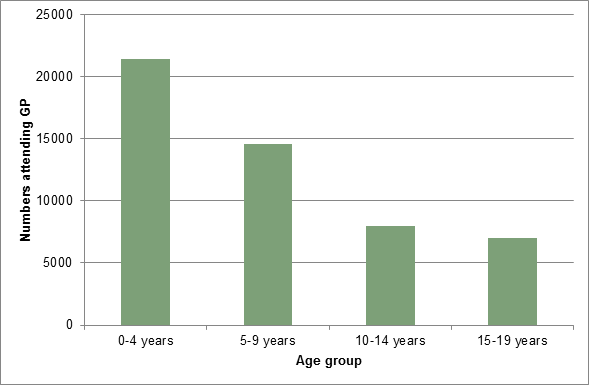
Figure 36 Numbers attending general practice by age group in Richmond upon Thames, 2012/13
Reasons for attendance
A breakdown by diagnostic category for those aged 0-4 years is shown in Figure 37. The single largest cause of attendance is respiratory system disease. The next most common reasons for attendance are skin and subcutaneous tissue diseases, nervous system and sense organ diseases, infectious and parasitic diseases and health status and contact with health services factors. Together, these top five categories account for more than three-quarters of attendance in general practice.
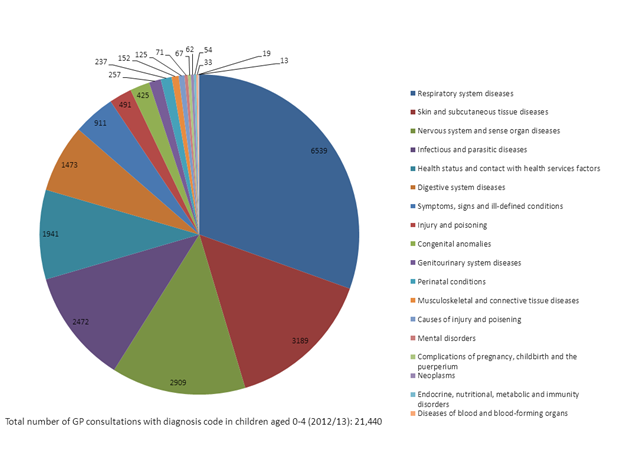
Figure 37 GP consultations in Richmond upon Thames for those aged 0-4 years by diagnostic category, 2012/13
Further breakdown of the top four diagnostic categories is shown in Figure 25. For respiratory system diseases the single largest diagnostic category is acute respiratory tract infections. For skin and subcutaneous diseases the largest category was ‘other’ skin/subcutaneous disorders and skin/subcutaneous infections. In nervous system/sense organ diseases the largest subcategories were diseases of the ear/mastoid process and diseases of the eye/adnexa. For infections and parasitic diseases, the largest sub-categories were viral diseases and exanthema and mycoses, see Figure 38.
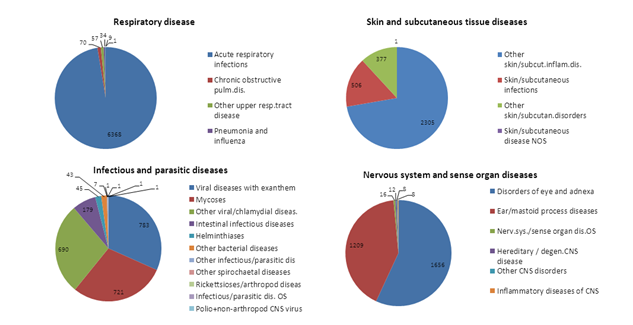
Figure 38 Sub-diagnostic categories of the top four diagnostic categories for children aged 0-4 years in Richmond up Thames, 2012/13
Diagnostic category reasons for GP attendance in the 5-9 year old age group is shown in Figure 26. Again, the top five diagnostic categories account for over 75% of attendance at the GP. For 5-9 year olds these are: respiratory system disease, infectious and parasitic diseases, nervous system and sense organ diseases, skin and subcutaneous tissue diseases and health status and contact with health services factors – see Figure 39.
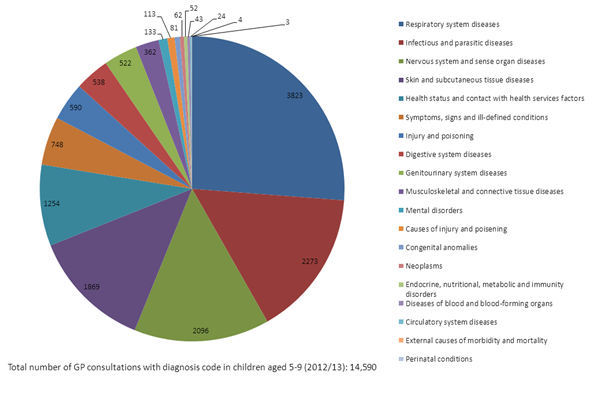
Figure 39 GP consultations in Richmond upon Thames for those aged 5-9 years by diagnostic category, 2012/13
The breakdown of sub-diagnostic categories is broadly similar to that seen in 0-4 year olds, see Figure 40.
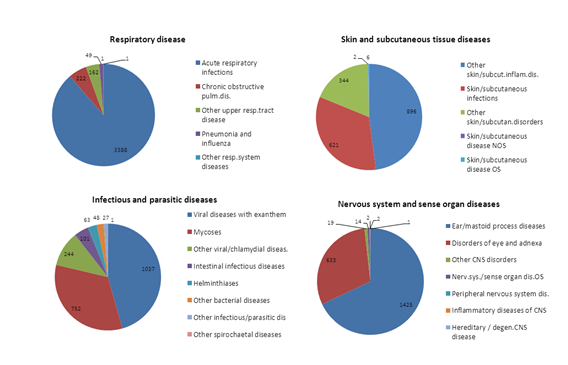
Figure 40 Sub-diagnostic categories of the top four diagnostic categories for children aged 5-9 years in Richmond up Thames, 2012/13
For 10-14 year olds, fewer attendances are due to respiratory system diseases but the top four diagnostic categories remain the same. A larger proportion of attendances are due to musculoskeletal and connective tissue diseases and to injury and poisoning than for younger age groups, see Figure 41.

Figure 41 GP consultations in Richmond upon Thames for those aged 10-14 years by diagnostic category, 2012/13
The pattern of illness among the top four sub-diagnostic categories is broadly similar to that seen in the 0-9 year old age group, see Figure 42.
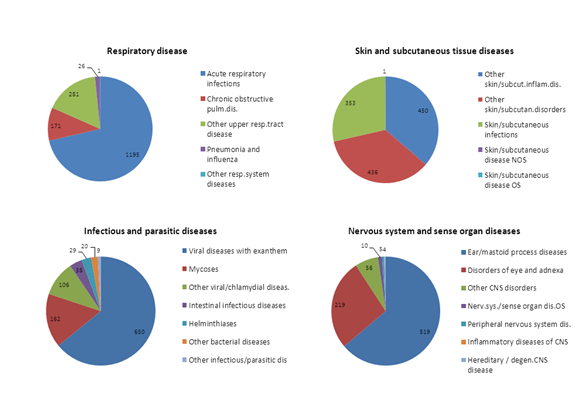
Figure 42 Sub-diagnostic categories of the top four diagnostic categories for children aged 10-14 years in Richmond up Thames, 2012/13
A much greater proportion of attendance in 15-19 year olds at general practice is for skin and subcutaneous tissue diseases and a lower proportion due to respiratory diseases, see Figure 43. Musculoskeletal and connective tissue diseases feature more prominently, as does genitourinary disease, when compared to younger age groups.
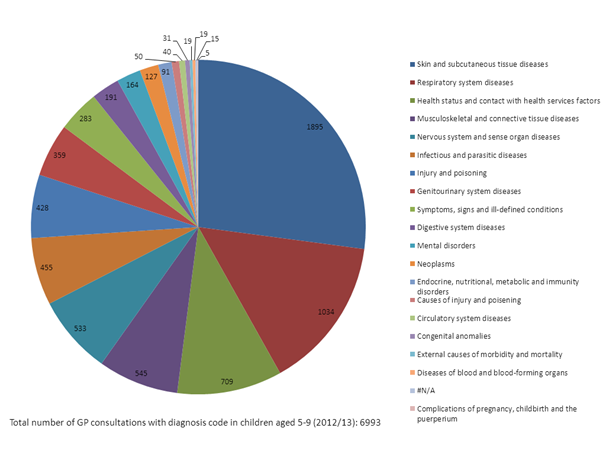
Figure 43 GP consultations in Richmond upon Thames for those aged 15-19 years by diagnostic category, 2012/13
The sub-diagnostic categories again are broadly similar, see Figure 44
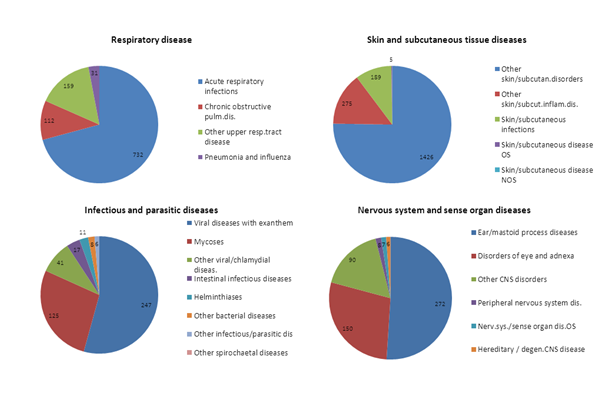
Figure 44 Sub-diagnostic categories of the top four diagnostic categories for children aged 15-19 years in Richmond up Thames, 2012/13
4 Local Services
Activity of local services is discussed under section 3 – Local Picture.
5 Conclusion
Trends
Trend analysis shows the number of children and young people attending A&E has been rising since 2008/09.
The rise for the 0-4 year old age group has been disproportionately greater than for those aged 5-19 years (see appendix 1 – figure 2). In 2010/11 the Richmond rate of A&E admissions among children 0-4 years was 504 per 1000 population, and was significantly higher (worse) than the rate for England (484).
Since 2011/12 performance has improved, attributable in part to the opening of the Urgent Care Centre in 2012 located at West Middlesex Hospital. The Richmond rate of A&E attendances for 0-4 year olds in 2011/12 was 484 per 1,000 population. This was the lowest in London and lower than the England average (511 per 1,000 population).
Despite the recent positive trend in rates, numbers A&E attendances remain significant. In 2013/14 there were 10,102 A&E attendances among those aged 0-19 years, with over half being under 5 years. A&E attendances among 0-19s represent 27% of all A&E attendances (all ages), at an annual cost of over £1million in Richmond borough.
In addition to the 10,102 A&E attendances in 2013/14, there were around 4,900 attendances of Richmond 0-19 year olds at urgent care centres/minor injuries units. 52% of these patients attended Hounslow urgent care centre.
Referrals
The majority of A&E attendances are through ‘self-referral’ (47%), i.e. parental behaviour, and only 5% of A&E attendances are referred by the GP. Teddington and Hampton and Twickenham and Whitton have the lowest rates of attendance in A&E and the highest rates are in East Sheen and Barnes.
There is a large degree of variation in the A&E provider attended according to the general practice at which patients are registered. This is related to the geographical access/distance to providers, i.e. parents’ decision which A&E departments to attend.
Socio-economic status is also important. A significantly higher proportion of those living in the most deprived areas in Richmond attended A&E in 2013/14 compared to less deprived areas. For example, 61% of children aged 0-4 living in the most deprived quintile attended A&E, compared to 47% of those living in the least deprived quintile.
Outcomes of attendances
We were not able to use data on the reason for A&E or urgent care centre attendance or the diagnosis as the quality of data is poor and incomplete. Instead, information on the outcome of A&E attendance (e.g. discharge without treatment, referral to GP, or admission) and the treatment function (HRG) code were used to assess care needs (and whether attendance was potentially ‘avoidable’.
66% of children and young people aged 0-19 years that were seen in A&E 2013/14 were ‘discharged without follow up or discharged to general practice’ (6,695 attendances). Such attendances could be judged as potentially avoidable.
Those attending A&E who have ‘no investigation with no significant treatment’ or who ‘received a category 1 investigation with category 1-2 treatment’ again may indicate a group where A&E attendances could possibly have been avoided. 62% of A&E attendances of children and young people aged 0-19 years received this level of treatment. For the 0-4 year old group, this constituted 71% of patients (3,629 patients).
The majority of attendances at Hounslow Urgent Care Centre resulted in discharge without further follow-up or discharge to the general practitioner (ranging from around 70% to over 80% depending on the age group).
Emergency admissions
16% of all A&E attendances among those aged 0-19 years resulted in emergency admission to hospital (1627 admissions in 2013/14). The number of emergency admissions has remained stable over the last 6 years.
Almost half of emergency admissions in the 0-4 year old age group were for respiratory disease and viral infection. For the 5-9 and 10-14 year old age groups a much greater proportion of emergency admissions was attributable to injury.
In 2013/14 there were around 400 emergency admissions for categories deemed to be avoidable[5]. These represented 18% of all paediatric emergency admissions and cost £414,000.
6 Recommendations
Potential pathway developments identified by providers are summarised below:
- Provide options for increasing GPs’ experience and training in paediatrics
- Improve communication between GPs and A&E/ paediatrics, particularly clinicians providing advice to GPs on management of particularly cases/problems
- Co-locate a paediatric trained nurse within general practice, A&E or urgent care centre for effective assessment and triage and follow up
- Provide information and guidance for parents on how to manage conditions/what services are available and appropriate use. All health professionals across primary care and secondary care should reiterate messages /ensure consistency of guidance (including receptionists). Develop the role of health visitors in parents’ self-management of conditions.
- Target respiratory pathway for more community-based management
- Better information for all health professionals/staff across primary care, community and secondary care, and 111 on what services are able – when and how to access, making appropriate referrals
- Coordinate developments across neighbouring CCGs, i.e. A&E departments service different borough residents. Recognise Trusts are already making plans to reduce emergency admissions /develop ambulatory care
- Ensure effective links between A&E and CAMHS re paediatric mental health cases/self –harming
References
[1] Total number of attendances/population – some patients have multiple attendances.
[2] Data for local authority not CCG population
[3] Data for local authority not CCG population
[4] Avoidable emergency admissions are defined according to the Everybody Counts indicators “CB_A6_01: Unplanned hospitalisation for chronic ambulatory care sensitive conditions”, “CB_A6_03: Emergency admissions for acute conditions that should not usually require hospital admission”, “CB_A6_02: Unplanned hospitalisation for asthma, diabetes and epilepsy in under 19s”, and “CB_A6_04: Emergency admissions for children with Lower Respiratory Tract Infections (LRTI)” as specified in the technical guidance for 2013/14: https://www.england.nhs.uk/everyonecounts
[5] It is important to note that in the 15-19 year old age group, self- poisoning accounted for almost 10% of admissions in 2012/13. This reflects the findings of related needs analysis on self-harm that raise concerns about self-harm among young people. In the two years 2010/11- 2012/13, there were 89 admissions for self-harm for young people under 19 years (most self-poisoning).
Document Information
Published: November 2015
For review: November 2018
Topic lead: Amanda Killoran, Public Health Principal
Appendices
Appendix A
Source of referral of A&E attendances by children and young people aged 0-19, 2013/14
|
Source of referral |
Number of attendances |
% of attendances |
|
General Medical Practitioner |
529 |
5% |
|
Self Referral |
4,888 |
49% |
|
Other, including: |
4,700 |
|
|
Local Authority Social Services |
19 |
0% |
|
Emergency Services |
168 |
2% |
|
Work |
2 |
0% |
|
Educational Establishment |
40 |
0% |
|
Police |
19 |
0% |
|
Health Care Provider: Same Or Other |
466 |
5% |
|
General Dental Practitioner |
1 |
0% |
|
Not Known |
40 |
0% |
|
Other |
3,945 |
40% |
|
Total |
9,915 |
100% |