This report is largely based on the content of the Richmond Cancer Strategy 2014-16, published in January 2015. Based on an update of the content and review of conclusions, this report was published in February 2016.
1 Executive Summary
1.1. Aim
The purpose of this needs assessment is to scope and review cancer services in Richmond. It aims to understand current cancer services and local needs and highlights key priorities, for Richmond CCG in partnership with the council and local agencies, to guide development and commissioning to improve services for Richmond patients.
1.2. Background
A steering group has been in place since 2011 with representation from cancer survivors, pharmacy, primary care, public health, commissioning support, and London Macmillan. This steering group has recently been reviewed and revised to respond to the recent NHS reforms and new cancer strategies.
1.3. Local Picture
In Richmond there are 3,410 cancer cases known to general practice (1.7% of people registered with a GP, compared to 1.9% in England and 1.4% in London, 2012/13). This has increased over the last four years (2009/10: 1.2%). Compared to other areas in England and London, the overall cancer incidence in Richmond is relatively low, but cancer incidence rates are increasing both nationally and locally. The proportion of people with cancer surviving for a year or more has increased, but cancer is the leading cause of death in Richmond.
1.4. Recommendations
In May 2014, the Cancer Commissioning Team – West and South (CCT) set out 19 recommendations for improving the early detection of cancer in their report called ‘Earlier Detection of Cancer’, grouped under 4 headings:
- Cancer clinical leadership and governance arrangements
- Primary care development
- Routes to diagnosis
- Audit, information and appraisal systems
2 Introduction
2.1. Aim
This needs assessment sets out the current and future challenges that cancer presents to people with cancer, their carers, friends and families. It also highlights key messages to guide the development and commissioning of services with local providers.
2.2. Who is this for?
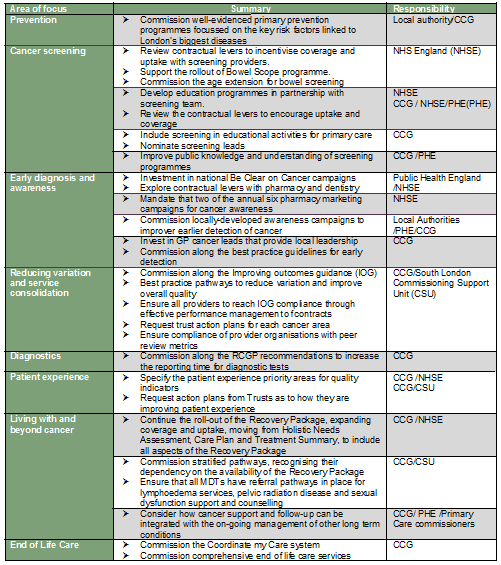
Re-shaping of the health and social care system means that the responsibilities for delivering the cancer agenda are complex; and are now shared across a number of agencies (See appendix 1). This needs assessment is intended to inform the policies, strategies, development and commissioning plans, and practice of the various local organisation involved.
- Local authority public health teams are responsible for offering specialist population health advice and for lifestyle prevention services.
- Public Health England (PHE) leads on national campaigns and intelligence reporting.
- NHS England (NHSE) is responsible for commissioning cancer screening services and core primary care services provided by GP practices and pharmacies. NHSE is also responsible for commissioning specialist services such as radiotherapy.
- Primary care is responsible for early detection and referral of patients for investigation.
- The Clinical Commissioning Groups (CCGs) are responsible for earlier diagnosis through reducing any health system delays and for commissioning secondary prevention activity and many of the treatment pathways. CCGs commission hospital services through South East Commissioning Support Unit (CSU).
- The voluntary sector provides a range of services to prevent cancer-and to support people with cancer and their carers and survivors of cancer.
3 Background
Cancer is the general name for a group of more than 100 diseases. The number of people diagnosed with cancer is rising, reflecting the impact of our ageing population as well as improvements in diagnosis. The largest increase will be in the elderly. Additionally, more people will live for longer with their cancer diagnosis as treatments improve.
Main risk factors for cancer include smoking, obesity, diet, sun exposure, physical inactivity, alcohol, infections and environmental risk factors. At least one-third of all cancer cases are preventable, and prevention offers the most cost-effective long-term strategy for the control of cancer. Stopping smoking is the single greatest avoidable risk factor. Regular physical activity and the maintenance of a healthy body weight, along with a healthy diet, will considerably reduce cancer risk. Appropriate prevention, screening, diagnosis, treatment and rehabilitation, support services for people living with and beyond cancer and end of life care will be required to address the changing cancer agenda.
3.1. Steering group
A steering group has been in place since 2011 with representation from cancer survivors, pharmacy, primary care, public health, commissioning support, and London Macmillan. This steering group has recently been reviewed and revised to respond to the recent NHS reforms and new cancer strategies.
Macmillan funded a lead GP post from 2011 to 2014 to develop initiatives to promote early detection and end of life care good practice. This GP worked across primary care to raise awareness of GP cancer profiles, audit tools, validated tools for detecting cancer, implementation of national guidance, and led the development and implementation of an end of life care strategy. This work included practice visits, training events, promotion of national campaigns, newsletters, development of interventions and services and representation at South West London and South London networks.
In 2013-14 the Cancer Commissioning Team – West and South (CCT) met with Richmond CCG and selected practices with a focus on early detection and cancer survival rates. A report highlighting the opportunities for CCGs to improve early detection and cancer survival rates and support from the new Transforming Cancer Services Team for London (TCST) is available.[1] A number of further reports on Cancer performance have been received and are referenced within this document.
3.2. National Picture
More than 1 in 3 people will develop a form of cancer at some point in their lifetime and it causes more than 1 in 4 deaths in the United Kingdom. In many areas of London, cancer has overtaken cardiovascular disease as the leading cause of death in the under 75 year age group. Cancer incidence increases with age; more than a third of cancers in the United Kingdom are diagnosed in people aged 75 years or over (2009-2011). In the UK there are approximately 1.8 million people living with and beyond a cancer diagnosis, and this is likely to rise by 3% per year with a prediction of over 4 million cancer survivors by 2030. Despite improvements in survival and mortality in recent decades, cancer outcomes in England remain poor when compared with the best outcomes in Europe.
4 Local Picture
Richmond has some of the best outcomes for cancer in London and the UK. Incidence and mortality rates show that the population of Richmond upon Thames has fewer cases and deaths from cancer per 100,000 than many other areas of England. Survival statistics are also better on average. Richmond has a joint health and social care End of Life Care (EoLC) strategy that has been successfully implemented over the past 4 years resulting in a 10% decrease in hospital based deaths – a key marker of the quality of EOLC services – and a corresponding increase in deaths in community settings.
4.1. Prevalence
Cancer prevalence is the number of people, or the proportion of the population, who are alive on a specified date and have previously been diagnosed with cancer. As such it is an indicator of the burden of cancer and can help to inform health care service planning. The number of people alive with a diagnosis of cancer is increasing as incidence rises and survival improves.
In Richmond there are 3,410 cancer cases known to general practice (1.7% of people registered with a GP, compared to 1.9% in England and 1.4% in London, 2012/13). This has increased over the last four years (2009/10: 1.2%).
4.2. Incidence
Cancer incidence is strongly related to age, with the highest incident rates being in older people, although other risk factors do also play a role. Compared to other areas in England and London, the overall cancer incidence in Richmond is relatively low. The age standardised incidence rate is 408/100,000 compared to an NHS London Strategic Health Authority average of 426/100,000 (2010). However, there are some differences by type of cancer. The incidence of breast cancer in Richmond (146.0 per 100,000) is higher than the English average (125.7 per 100,000) and similar to Kingston (140.7 per 100,000), while the incidence of other types of cancers, including lung cancer, bowel cancer and prostate cancer in Richmond is lower than or similar to the national average (lung cancer: 34.5/100,000 compared to 47.7/100,000; bowel cancer 45.4/100,000 compared to 46.5/100,000; prostate cancer 113.1/100,000 compared to 105.8/100,000).
Cancer incidence rates are increasing both nationally and locally. Between 1995-1997 and 2009-11, the cancer incidence rate has increased in Richmond from 385/100,000 to 397/100,000 for men and from 334/100,000 to 373/100,000 for women.
4.3. Survival
Survival estimates are the percentage of patients who are still alive at a specified time after their diagnosis of cancer. Cancer survival rates are influenced by early diagnosis and treatment. Rates in Richmond are relatively high; however this reflects Richmond’s lower rates of prevalence and incidence, and the slightly lower projected proportion of older people than the national average.
Cause-specific one-year and five-year survival rates for breast cancer, lower GI cancer and lung cancer are also similar or better in Richmond than the average for London and England (5 year survival rate – Breast cancer: Richmond 83.6%, London 83.8%, England 84.7%; Lower GI cancer: Richmond 59.5%, London 53.3%, England 52.7%; Lung cancer: Richmond 12.4%, London 9.7%, England 8.6%).
The graph below shows that the proportion of people with cancer surviving for a year or more has increased over previous years in Richmond and England. Nationally, the number of cancer survivors in the UK is projected to increase by approximately one million per decade from 2010 to 2040.
Figure 1 One-year survival rates for all cancers combined, by calendar year of diagnosis in adults
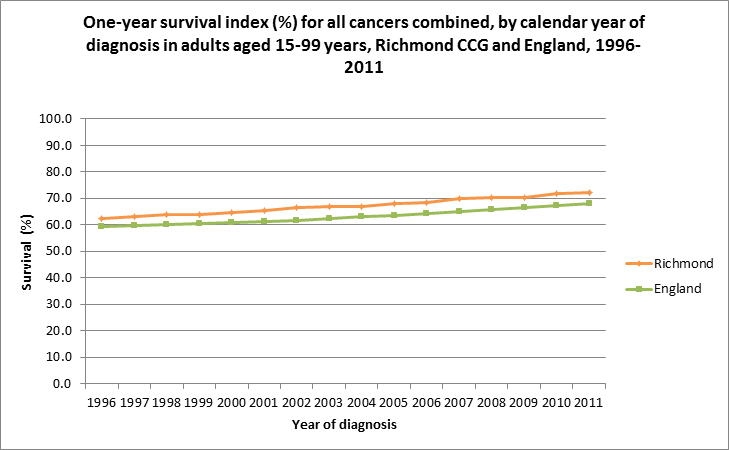
Source: Office for National Statistics and London School of Hygiene and Tropical Medicine[2]
4.4. Mortality
Mortality rates are determined by incidence and survival rates. Cancer is the highest cause of death in Richmond. In 2013, 349 deaths in Richmond were caused by cancer, compared to 135 deaths caused by diseases of the circulatory system (all ages). Cancer is also the highest cause of premature death in Richmond (155 deaths). Compared to England, the number of deaths due to cancer in people under 75 years is relatively low (ranked as 18th lowest LA). The five-year age-standardised mortality rate is 150/100,000 compared to the NHS London Strategic Health Authority average of 171/100,000 (2007-2011).
5 Local Services
5.1. Screening
The proportion of people aged 60-69 attending for bowel cancer screening is 54.9%, this is lower than the English average 57.4%. Screening coverage for breast (70.3%) and cervical cancers (71.9%) are also slightly lower in Richmond than the national average (76.3% and 73.9%, 2013). This is similar to London screening rates which tend to fall below the national average, and in affluent areas private healthcare may also have an impact.
5.2. Primary Care
There are 29 GP practices within Richmond CCG. In 2012, Richmond CCG referral rate is lower than that for England (8.3% vs 10.6%). There is variation within GP practices two-week referral rates, and the result of these referrals indicated by the positive cancer diagnosis achieved (conversion rate variation 3%-25%) suggesting potential for improvements across primary care.1
5.3. Secondary care
There is no hospital located within the boundaries of Richmond upon Thames. Richmond residents access hospital services at Kingston, West Middlesex, Imperial, St Georges and The Royal Marsden.
Secondary care performance is managed by the CSU. Any performance issues identified by the CCG and CSU will require monitoring and feedback to CCG Quality Performance and Finance Committee. Kingston hospital improvements programme, particularly, will require monitoring.
This report presents data for the most recent complete financial year, 2013-14.
Table 1 Cancer Waiting Statistics 2013-14, NHS Richmond CCG

Source: CSU/Transforming cancer services team
Performance was on target for 2013-14, but it is important to note that in 2014-15, performance has dipped. Richmond CCG has failed the two week and 62 day GP referred cancer wait targets for Q1 and Q2 this year. Patient choice is the most commonly cited cause for breach on the 2 week waits, reasons for breaching the 62 day target from GP referral are varied.
Table 2 Cancer Waiting Statistics Q1 and Q2 2014-15, NHS Richmond CCG
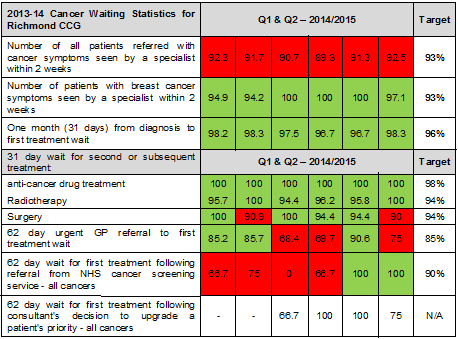
5.4. Two week wait performance
Since December 2000, all patients referred by their GP with a suspected cancer should be seen within two weeks of referral unless they choose to wait longer. The operational standard is 93%.
In 2013-14, the percentage of people who attended outpatient appointments following a two week wait from referral for suspected cancer to being seen by a specialist was 94.8% in Richmond, similar to London (94.8%) and England (95.5%). Since April 2014, the CCG has failed to meet the 2 week referral target.
The TCST published a report on the 20 North West and South London CCG’s 2WW Conversion Rates 2013-14 in October 2014.[3] The purpose of this report was to provide a CCG level analysis of the conversion rate of urgent suspected cancer referrals (2WW) into a diagnosis of cancer in 2013/14. CCG conversion rates for all cancers across the 20 North West and South London CCGs range between 3.8% and 9.7%. The Richmond CCG conversion rate was 7% (276 patients treated / 3,962 patients seen). In Richmond, tumour sites with the highest conversion rate were haematology, urology and sarcoma. The tumour sites with the lowest conversion rates were head and neck, gynaecological, and upper gastrointestinal.[4]
5.5. 62-day standard performance (first treatment)
The proportion of people treated within 62 days from urgent referral for suspected cancer to first treatment in Richmond was 87% compared to 84% regionally and similar to 87% nationally. Performance has fallen below target once in Q1 (68%) and twice in Q2 (70% and 75%).The operational standard is 85%.
5.6. Late diagnosis
19.1% of patients in Richmond CCG are diagnosed with cancer through emergency routes; although this is lower than the English average (23.7%), there is room for improvement. Table 3 below provides a breakdown by key cancer types.
Table 3 Percentage diagnosed through emergency routes, 2006-2010

Source: National Cancer Intelligence Network (NCIN). https://www.ncin.org.uk/publications/routes_to_diagnosis
Staging information was requested and reviewed to further inform this strategy. However, the data received was only 48% complete and meaningful conclusions could not be drawn. Nationally PHOF reports that only 41.6% is diagnosed at an early stage, i.e., the number of new cases of cancer diagnosed at stage 1 and 2 as a proportion of all new cases of cancer diagnosed, 2012.
5.7. Living with and beyond cancer
The voluntary sector also plays an important role in supporting people with cancer and beyond and their carers. Locally, the Mulberry Centre provides support to patients and carers and has extended its role into prevention by promoting awareness of signs and symptoms.
5.8. Overall performance
Some key performance challenges have been identified:
- Screening rates
- Variation in primary care
- Kingston Hospital is undergoing an improvement programme for cancer services. The 2 week wait performance for Richmond CCG has been below target since April 2014 and the 62 day standard continues to deteriorate.
6 Conclusion
The number of people diagnosed with cancer is rising, reflecting the impact of our ageing population as well as improvements in diagnosis. Additionally, more people will live for longer with their cancer diagnosis as treatments improve.
The responsibilities for prevention and early detection are now split between different organisations. Local public health teams are responsible for offering specialist population health advice and primary prevention. Public Health England leads on national campaigns to raise awareness of signs and symptoms and also has a role in data collation and dissemination for cancer indicators. The Clinical Commissioning Group should work to improve earlier diagnoses through liaison with the CSU to reduce health system delays and may commission and support some early diagnosis and prevention activity within primary care and the wider community.
7 Recommendations
In May 2014, the Cancer Commissioning Team- West and South (CCT) set out 19 recommendations for improving the early detection of cancer in their report called ‘Earlier Detection of Cancer’ – grouped under 4 headings:
- Cancer clinical leadership and governance arrangements
- Primary care development
- Routes to diagnosis
- Audit, information and appraisal systems
7.1. Cancer clinical leadership and governance arrangements
- Invest in Cancer Clinical Leads with oversight of the CCG’s early detection agenda and responsibility for ensuring that this features in the Operating Plan and Primary Care Development Programme and appropriate linkages made to the Long Term Conditions agenda. In some CCGs, this role is undertaken by a Macmillan funded GP.
- Agree a clear cancer brief with the local Public Health team and facilitate joint working between Public Health, the local authority, cancer clinical lead, CCG and primary care. This will add value by combining public health metrics with soft intelligence from primary care to inform priority setting, action planning and implementation at CCG level.
- Identify an existing CCG forum which can lead the co-ordination of early detection.
- Work with the appropriate Health and Wellbeing Board on the development of cancer priorities for the population and assume joint accountability for cancer prevention.
- Request regular updates from NHS England regarding screening uptake and use this information to support action at practices and populations where uptake is below target.
- Include cancer early detection and awareness in the CCG’s user involvement programme.
7.2. Primary care development
- Promote the roll out of ‘Train the Trainers’ to all GP trainers in the CCG. This programme is aimed at developing local capability in early detection, through training GP trainers in the relevant metrics (practice profiles) and development tools so they can pass these on to GPs, GP Registrars and primary care teams. As mentioned earlier, this work needs Public Health and analytical support to deliver added value.
- Use a professional cancer awareness tool (Pro CAM) to track GP confidence and awareness in the early detection of cancer before and after a training programme to measure the level of change in GP awareness and behaviour.
- Include early diagnosis of cancer in the training and development programme for primary care teams. Effective management of cancer in primary care requires a whole team approach including pharmacists, nurses, HCAs and non-clinical staff.
- Explore options to join up development programme interventions with neighbouring CCGs.
- Encourage involvement of local Patient Partnership Group (PPG) in the practice level cancer agenda and particularly the promotion of Be Clear on Cancer Campaigns.
7.3. Routes to diagnosis
- Prioritise practices in the ‘low 2WW conversion rate/ low 2WW detection rate’ quadrant for developmental intervention, to understand the reasons behind the trends and develop plans to address issues raised. This builds on a key learning point from the project to use this combination of metrics as a potential marker for quality in primary care.
- Develop a policy governing coding of two week wait referrals for clinical governance purposes and encourage audit to determine quality of referrals and underlying reasons. Use the findings to inform the development of a cancer pathway governance framework in primary care.
- Ask practices to audit emergency presentations with cancer as Significant Events and to report on the key findings to the CCG Cancer Lead.
- Encourage adoption of Cancer Risk Assessment Tools, which help guide clinical decision making based on objective risk-based assessment. The Cancer Decision Support Tool software is in development and is likely to be available later in 2014.
7.4. Audit, information and appraisal systems
- Encourage use of RCGP audit within and across practices. Ask teams to collate their findings and provide aggregated feedback to participating practices. This encourages primary care teams to engage with their own data, under the guidance of the CCG.
- Integrate cancer audit activities with broader processes for audit and appraisal.
- Use practice profile data to monitor trends in referral patterns and share data with practices on an annual basis.
- As staging data becomes available, use this to identify which types of cancer, patient groups and practices have more cancers diagnosed at late stage and where further investigation and support may be needed.
References
[1] Earlier Detection of Cancer, Using Practice Profiles and other developmental tools to improve the management of cancer in primary care, NHS Richmond CCG, Final report: Cancer Commissioning Team- West and South, May 2014 https://www.richmondccg.nhs.uk/Governing%20Body%20Papers/22-09-2015/20150922%20F(2)%20-%20Cancer%20Strategy.pdf
[2] A Cancer Survival Index for Clinical Commissioning Groups, Adults Diagnosed 1996-2011 and Followed up to 2012 https://www.ons.gov.uk/ons/rel/cancer-unit/a-cancer-survival-index-for-clinical-commissioning-groups/adults-diagnosed-1996-2011-and-followed-up-to-2012/index.html
[3] Transforming Cancer Services Team – West and South London North West and South London CCG’s 2WW Conversion Rates 2013-14
[4] Transforming Cancer Services Team – West and South London, NHS Richmond CCG, Cancer Performance Report, M7: 2014-2015
Document Information
Published: January 2016 For review: January 2018 Topic lead: Usman Khan, Public Health Principal
Appendices
Appendix 1