1 Executive Summary
Introduction
This needs assessment report aims to set out the historic trends and current local picture of special educational needs and disability (SEND) for infants, children and young people aged 0-25 years of age resident in Richmond upon Thames.
The report is intended to inform local policies, strategies, service developments, commissioning plans, and practice; including Richmond’s Achieving for Children (AfC) SEND strategy 2015–18.
Methods
The report includes consideration of comparative historic and current data on population characteristics potentially influencing need for SEND services, levels of SEND services, and outcomes for children and young people.
Where data allows, findings are presented comparing Richmond with Wandsworth, Kingston, London and England; over the period 2010-2015.
The report excludes the assessment/review/evaluation of the nature and quality of local SEND service provision.
Key findings are summarised in the following sections.
Population
Key findings relating to the numbers of children and young people include:
- Richmond’s resident population of children and young people (aged 0-24 years) grew by 7% over the period 2010-2015 to 56,800. This is projected to grow by a further 6% to 60,600 by 2020.
- The total number of pupils attending Richmond schools (includes all mainstream & special schools) grew by 14% over the period 2010-2015 to 34,857. Of these 16,621 are in primary school and 7,870 in secondary school in the state-funded sector (total 24,492).
- The total number of pupils attending special schools in Richmond grew by 22% over the period 2011-2015 to 192.
- The total number of pupils attending state-funded mainstream Richmond schools is projected to grow by a further 21% to 28,459 by 2020.
Population characteristics influencing SEND needs
A variety of population characteristics influence the levels and nature of SEND needs. These are multi-factorial, complex, and interrelated; and include a wide range of personal and family characteristics and disabilities. Key findings include:
- Dependent children and young people resident in Richmond are less likely to be living in poverty than other areas.
- Pupils in Richmond schools are less likely to be eligible and claiming free school means than in other areas.
- Richmond has lower levels of Looked After Children than other areas.
- Richmond has lower levels of children subject to child protection plans than other areas. However, rates have risen in recent years.
- Richmond has lower levels of Children in Need than other areas. However, in Richmond a higher proportion of those in need appear to have disabilities.
- Children and young people in Richmond are less likely to have limitations of day-to-day activities due to long-term health problems or disabilities than in other areas.
- Estimates suggest that children in Richmond experience less mental health problems than other areas.
- Children in Richmond are less likely to experience visual disabilities than other areas.
- Children and young people in Richmond are less likely to receive Disability Living Allowance than other areas.
Numbers & needs of children receiving SEND services
Key findings relating to the numbers and needs of children receiving SEN services include the following.
Numbers in all schools
- As of January 2015, in all Richmond schools there were 844 (2.4%) pupils with SEN statements and 3,372 (9.7%) receiving SEN support, a total of 4,216 (12.1%). Comparison to other areas suggests that:
- Levels of SEN statements are similar to other areas, except Wandsworth which has a higher level.
- Levels of SEN support are lower than other areas, except Kingston which has a lower level.
- Levels of overall SEN service provision (i.e. statements+support) are lower than other areas, except Kingston which has a lower level.
- Over the period 2010-2015, levels of all SEN provision in Richmond in all types of schools has remained roughly stable, whereas the other areas have experienced a decline.
- Over the period 2010-2015 the percentage of SEN statements in Richmond has remained steady, while between 2014 and 2015 there was a small decline in the percentage of pupils receiving SEN support services.
Numbers in state primary schools
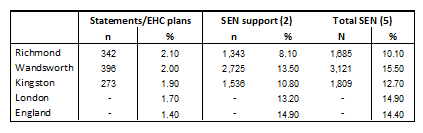
- As of January 2015, in Richmond state primary schools there were 342 (2.1%) pupils with SEN statements and 1,343 (8.1%) receiving SEN support, a total of 1,685 (10.1%). Comparison to other areas suggests that:
- Levels of SEN statements are higher than other areas.
- Levels of SEN support are lower than other areas.
- Levels of overall SEN service provision (i.e. statements+support) are lower than other areas.
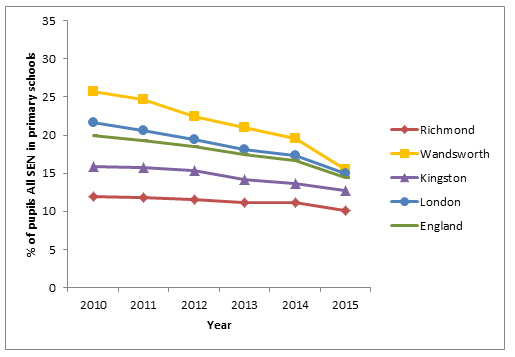
- Over the period 2010-2015, levels of all SEN provision in Richmond in state primary schools has shown a shallow decline compared to steeper declines in other areas.
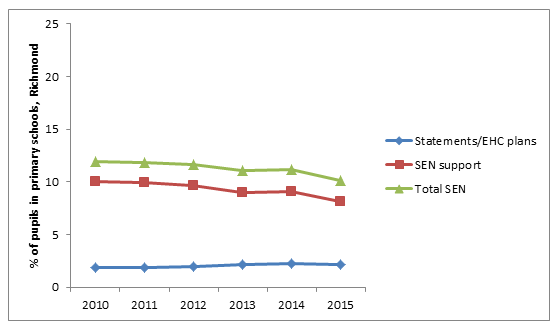
- Over the period 2010-2015 the percentage of SEN statements in Richmond has risen very slightly and there has been a small decline in the percentage of pupils receiving SEN support services.
Numbers in state secondary schools
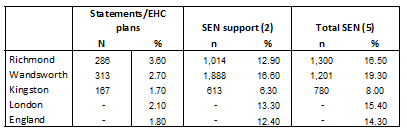
- As of January 2015, in Richmond state primary schools there were 286 (3.6%) pupils with SEN statements and 1,014 (12.9%) receiving SEN support, a total of 1,300 (16.5%). Comparison to other areas suggests that:
- Levels of SEN statements are higher than other areas.
- Levels of SEN support are similar to England and London, but lower than Wandsworth and much higher than in Kingston.
- Levels of overall SEN service provision (i.e. statements+support) are similar to those for SEN support above.
- Over the period 2010-2015, levels of all SEN provision in Richmond state secondary schools, like other areas, has shown a steady decline.
- Over the period 2010-2015 the percentage of SEN statements in Richmond has remained steady and there has been a substantial decline in the percentage of pupils receiving SEN support services.
Needs of children receiving SEN services
- In Richmond primary schools the most common SEN needs are:
- Speech, language & communication (n=292)
- Specific learning disability (n=263)
- Moderate learning disability (n=246)
- Social, emotional & mental health (n=211)
- Autistic spectrum disorder (n=129)
- In Richmond secondary schools the most common primary SEN needs are:
- Specific learning disability (n=385)
- Social, emotional & mental health (n=276)
- Moderate learning disability (n=125)
- Speech, language & communication (n=120)
- In Richmond Special Schools almost all pupils have one of the following four primary SEN needs:
- Moderate learning disability (n=102)
- Autistic spectrum disorder (n=48)
- Social, emotional & mental health (n=17)
- Severe learning disability (n=17)
Outcomes
- Levels of Early Years and Foundation stage learning development classified as Good are substantially lower among children receiving SEN Support compared to those receiving no SEN services in Richmond schools. Also, over the period 2009-2014 levels have declined in the children receiving SEN support, and the scale of the gap with children receiving no SEN services is larger than in other *areas (note: this finding is based on analysis of small numbers of SEN support children).
- Levels of phonics decoding among Year 1 pupils with SEN statements and receiving SEN support is substantially lower than in those receiving no SEN services in Richmond schools. Over the period 2012-2014 improvements in levels have occurred in children receiving SEN services at a similar rate to those receiving no SEN services.
- Attainment of level 4 Key Stage 2 learning outcomes is substantially lower in children receiving SEN services compared to those receiving no SEN services in Richmond schools. Over the period 2009-2014 the gap in attainment has remained broadly stable.
- Attainment of 5+ A*-C grade GCSEs is lower in children receiving SEN services compared to those receiving no SEN services in Richmond schools. Over the period 2010-2014 attainment levels have declined both in children with SEN statements and receiving SEN support.
- Levels of persistent school absence are higher in SEN support and SEN statement pupils than in no SEN service pupils in Richmond schools. Compared to other areas, levels in Richmond are generally slightly higher in SEN support pupils and lower in SEN statement pupils.
- Levels of school exclusion are higher in SEN support and SEN statement pupils than in no SEN in Richmond schools. Compared to other areas, exclusion levels are slightly higher than in Wandsworth and Kingston in SEN support pupils, and higher than all areas in SEN statement pupils.
- Levels of young people (aged 16-17) not in education or training are higher in those who had a SEN statement when leaving school or with a Learning Disability Assessment (LDA) in Richmond. Compared to other areas, the difference in Richmond is larger and has widened over the period 2013-2015.
2 Introduction
Aim
This needs assessment report aims to set out the historic trends and current local picture of special educational needs and disability (SEND) for infants, children and young people aged 0-25 years of age resident in Richmond upon Thames.
Who is this for?
This needs assessment report is intended to inform policies, strategies, service developments, commissioning plans, and practice in local organisations including Council teams, NHS organisations such as the Clinical Commissioning Group (CCG) and Trusts, and other organisations, such as the voluntary sector and representatives of the public and patients.
The report specifically seeks to support the development of Richmond’s Achieving for Children (AfC) SEND strategy 2015–18.
Scope
The scope of the report and its supporting analyses is defined in terms of included and excluded parameters.
Included
The scope of the report includes consideration of:
- Population-level data on Richmond residents & school pupils, including demography, population characteristics potentially influencing need for SEND services, children & young people receiving SEND services, & outcomes.
- Reliable secondary data sources (e.g. DfE, PHE).
- Local scale of SEND need & volume of receipt of services/provision capacity.
- Comparative levels of local need & volume of receipt of services/provision capacity.
- Historic trends & current situation.
Excluded
The scope of the report excludes consideration of:
- Description and assessment/review/evaluation of the nature and quality of local SEND service provision.
- Engagement with local SEND provider organisations, professionals, parents, children and young people.
- Primary & individual level data.
Approach
The report and supporting analyses uses accepted approaches for Population Health Needs Assessment, and as such considers a range of population-level data sources which provide insight in to local SEND needs.

Data
Assessing the levels and nature of population need for SEND services requires acknowledgement that:
- SEND needs are influenced by a wide range of underlying population characteristics
- SEND services span a number of sectors and providers
- SEND outcomes are multi-dimensional
Consequently consideration of a wide variety of heterogeneous data types from multiple sources is necessary. Fortunately sources of reliable secondary analyses of relevant statutory open-source SEND data are available, minimising reliance on locally generated data and analyses, and allowing valid comparisons of Richmond with other areas.
The scope of the analytic structure of the report (see Figure above) and the variety of data types necessary to fulfil this, mean that a range of types of measures are used. These are noted in the reporting of the findings in the following chapters and include:
- Actual numbers/reported counts (e.g. number of resident children or pupils attending a school)
- Estimated numbers in Richmond, based on modelling of research undertaken elsewhere (e.g. numbers of children with a disability)
- Projected future numbers in Richmond based on stated assumptions (e.g. future number of resident children or pupils attending a school)
Findings are reported as numbers, to provide insight into the local scale of need; and as percentages or population rates (e.g. x children/1000 resident child population), to provide insight into the relative level of a need compared to other areas.
Unfortunately not all necessary data is available on a consistent population basis. In particular, some available data and secondary analyses consider Borough residents and some pupils attending schools in the Borough (wherever they are resident). Also, some data includes all school types and others just state funded primary and secondary schools (i.e. excluding special schools).
The definitions of schools included are:
- All: Includes maintained and direct grant nursery schools, maintained primary and secondary schools, city technology colleges, academies, special schools, pupil referral units
- Primary: Includes state-funded middle schools as deemed and primary academies.
- Secondary: Includes state-funded middle schools as deemed, city technology colleges and secondary schools.
Consequently it is necessary to make careful assumptions in interpreting the analyses collectively to learn as much as possible from the data available.
The following data are included in the report.
Population
- Resident population estimates aged 0-24 years (2010-2015)
- Resident population projections aged 0-24 years (2015-2020)
- Mainstream school population – all, primary & secondary (2010-2015)
- Mainstream school population projections – all, primary & secondary (2015-2020)
- Special school population (2011-2015)
Population characteristics influencing SEND needs
- Children & dependent young people living in poverty (2009-2013)
- Pupils eligible & claiming free school meals (2010-2015)
- Looked After Children aged <17 years (2010-2015)
- Children subject of a child protection plan (2011-2014)
- Children assessed as in need (2010/11-2013/14)
- Children in need with disabilities & receiving SEN services (March 2014)
- Maternal age and low birth weight
- Children & young people aged <25 years with limited activities due to long-term health problems or disability (2011).
- Estimated number of children with mental health problems.
- Estimated numbers of young people with learning disabilities.
- Estimated numbers of young people with physical disabilities.
- Children with visual disabilities.
- Children & young people receiving Disability Living Allowance (DLA) (2010-2015).
Children receiving SEN services
- Children with SEN statements/EHC plans & receiving SEN support (2010-2015).
- Needs of children receiving SEN services (2010-2015).
Outcomes
- Early years & foundation stage ‘good’ development attainment (2009-2014).
- School year 1 phonics decoding attainment (2012-2014).
- School key stage 2 level 4 attainment (2009-2014).
- GCSE 5+ A*-C grade attainment (2010-2014).
- Persistent school absence (2012 & 2013).
- School exclusion (2012 & 2013).
- Young people (aged 16-17) in education or training (2013-2015).
Methods
The analyses employ a descriptive epidemiology approach. This allows findings of the elements set-out in the figure above to be triangulated and conclusions drawn.
Where the availability of data permits cross-sectional comparative analysis of Richmond is undertaken alongside the following:
- Wandsworth
- Kingston
- London
- England
Consideration is given to:
- Historic time trends (2010 – 2015)
- Most up to date/current data available
Where possible analysis findings are presented in both as absolute numbers proving insight into the ‘size’ of need, as well as percentage or rate measures, where appropriate, in order to allow more valid comparison between ‘level’ of SEND need among areas, as a potential insight into the appropriateness of the level of service access.
Report structure
The report is set-out as follows (also see Figure 1).
Chapter 3 provides a brief background on SEND, including key definitions, the national policy framework, and local strategy and service offer.
Chapter 4 provides an overview of the numbers of children and young people resident in Richmond or attending schools in Richmond. Chapter 5 looks into population characteristics influencing SEND need and the prevalence of relevant disabilities affecting children and young people in Richmond. Chapter 6 sets-out analysis of children and young people receiving SEND services. Chapter 7 reports a selection of population outcome measures relevant to children and young people with SEND needs.
Finally, Chapter 8 discusses the report’s findings and draws conclusions.
3 Background
Definitions
Under Section 20 of the Children and Families Act 2014 and Section 312 of the 1996 Education Act, a child or young person has special educational needs if they have a learning difficulty or disability which calls for special educational provision to be made for them.
Children are defined as have a learning difficulty or disability if they:
- Have a significantly greater difficulty in learning than the majority of others of the same age.
- Have a disability which prevents or hinders them from making use of facilities of a kind generally provided for others of the same age in mainstream schools or mainstream post-16 institutions.
- Are under compulsory school age and fall within one of the definitions above or would do so if special educational provision was not made for them.
Children must not be regarded as having a learning difficulty solely because the language or form of language of their home is different from the language in which they will be taught.
Special educational provision is defined as either:
- For children of 2+ years: educational provision additional to, or different from, the educational provision made generally for children of their age in schools maintained by the local authority, other than special schools, in the area.
- For children under 2 years: educational provision of any kind.
In addition, the SEND Code of Practice sets out the following four broad areas of need and support which may be helpful when reviewing and managing special educational provision:
- Communication and interaction
- Cognition and learning
- Social, emotional and mental health difficulties
- Sensory and/or physical needs
National SEND policy
The Children’s and Families Act 2014 introduced major changes in the system for children and young people with special education needs and disability.
The vision of the special educational needs and disability reforms is of a system which joins up help across education, health and care, from birth to 25; with a focus on outcomes, improved relationships with parents, greater engagement with children and young people, and improved transition to adulthood.
Key changes include:
- A new Special Educational Need (SEN) Code of Practice.
- A requirement for local authorities and schools to publish a Local Offer.
- Introduction of Education health and Care Plans (EHCPs) in place of statements of special educational needs.
- Enabling children, young people, parents and carers to be involved in influencing decisions made about their education.
- The ability for local authorities and health services to offer services through a personal budget to children and young people with an EHCP.
- Involving children, young people, parents and cares in planning, commissioning and reviewing services.
- A 0-25 service which prepares young people for adulthood, including independent living and employment.
Local strategy & service offer
The local strategy for Special Education Needs for children and young people is the ‘SEN strategy 2016/2019’ by Achieving for Children (AfC) (January 2016). This is a partnership strategy, encompassing Kingston and Richmond boroughs, and partner organisations including the CCGs, schools, families and voluntary sector.
This strategy is for children and young people (and their families or carers) aged 0 to 25 years with SEN. The aim is to improve their outcomes in terms of:
- Progress made towards high expectation targets
- Access to a full educational curriculum and experience
- Progress to higher education or employment
- Independent living
- Participating in society
- Being as healthy as possible in adult life
The full local offer of services is set out at the link https://www.afclocaloffer.org.uk/
4 Local Picture: Population
Introduction
The following sections consider the numbers of and trends of children and young people aged 0 to 24 years. The populations of both of Richmond residents and pupils attending schools in Richmond are outlined.
Resident population
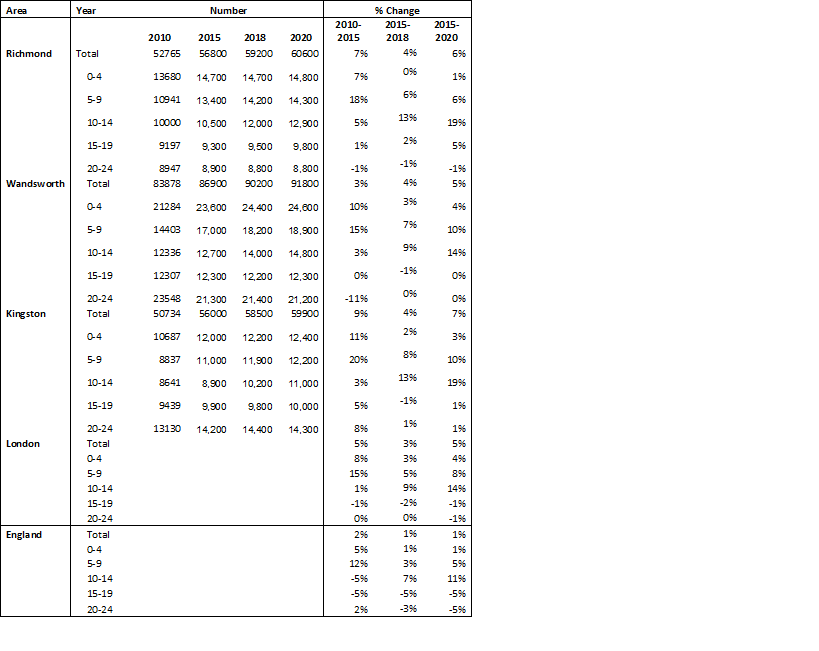
The table shows estimated and projected resident populations of all children and young people (aged 0 – 24 years) in Richmond and the comparison areas, in total and key age bands, in terms of numbers and percentage historic and future change.
Table 1: Resident population (aged 0-24 years) 2010-2020: Numbers & % Change
Source: Population Estimates Analysis Tool, from the Office for National statistics, released Jun 2015.GLA, Office for National Statistics (ONS) population estimates, Borough and Ward, created 2014. Projections: Subnational population projections for England: 2012 – based, from the Office of National Statistics, released May 2014.
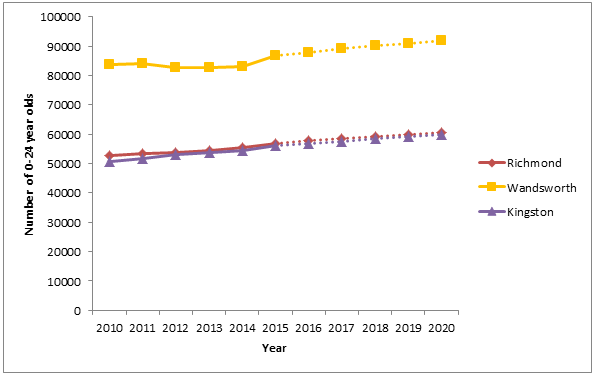
Figure 2: Historic & projected resident population (aged 0-24 years) 2010-2020
Source: Population Estimates Analysis Tool, from the Office for National statistics, released Jun 2015.GLA, Office for National Statistics (ONS) population estimates, Borough and Ward, created 2014. Projections: Subnational population projections for England: 2012 – based, from the Office of National Statistics, released May 2014.
As shown in the Table and Figure above, the current estimated total resident population aged 0-24 years in Richmond is 56,800; compared to 86,900 in Wandsworth and 56,000 in Kingston.
Between 2010 and 2015, it is estimated that Richmond’s resident population aged 0-24 years has increased by 7%, compared to 3% in Wandsworth, 9% in Kingston, 5% in London, and 2% in England.
Resident population projection
The total resident population aged 0-24 in Richmond is expected to continue to increase. Projections show that the number of children and young people will increase by 3,800 (6%) to a total of 60,600 between 2015 and 2020.
Similar proportionate increases are also expected in the comparator areas, except in England as a whole, where just a 1% increase is expected.
School population
The following sections outline, where data allows, the historic, current, and future population of pupils attending mainstream and special schools in Richmond.
Mainstream schools: Current pupil population & historic trend
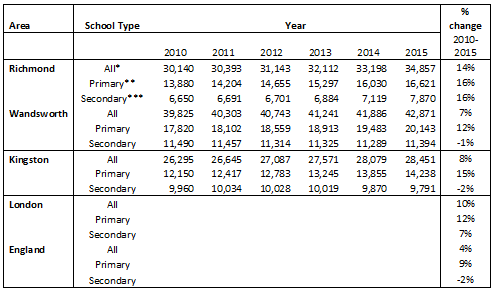
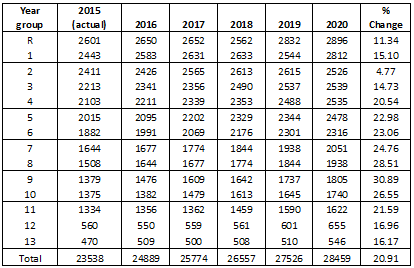
Table 3: Total school population 2010-2015: Numbers & % change
Source: Special educational needs in England: Jan 2015/2014/2013/2012/2011/2010, from the Department of Education.
Notes:
*Includes maintained and direct grant nursery schools, maintained primary and secondary schools, city technology colleges, academies, special schools, pupil referral units.
**State-Funded primary schools: Includes middle schools as deemed and primary academies.
***State-Funded Secondary schools: Includes middle schools as deemed, city technology colleges and secondary schools.
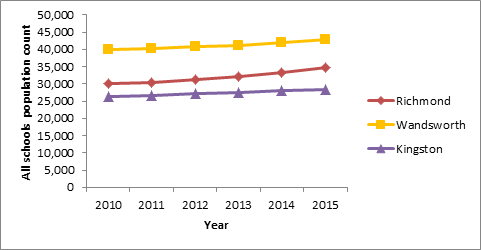
Figure 3: Total school population 2010-2015: Number
Source: Special educational needs in England: Jan 2015/2014/2013/2012/2011/2010, from the Department of Education.
Note: Includes maintained and direct grant nursery schools, maintained primary and secondary schools, city technology colleges, academies, special schools, pupil referral units.
As shown in the Table and Figure above, the current estimated total population of children in all schools in Richmond is 34,857, in state-funded primary schools is 16,621, and in state-funded secondary schools is 6,650.
Since 2010, it is estimated that the number of children attending schools in Richmond has increased, in all school types by 4,717 (14%), state-funded primary schools by 2,741 (16%), and state-funded secondary schools by 1,200 (16%). Richmond has experienced larger proportionate increases than in the comparator areas.
- Mainstream schools: Projected pupil population
Table 4: Mainstream school population projections, Richmond 2015-2020
Source: Achieving for Children, Richmond Local Data analysis
Note: Includes maintained and direct grant nursery schools, maintained primary and secondary schools, city technology colleges, academies, special schools, pupil referral units.
As shown in the table above, the total population of children attending all mainstream school types in Richmond is expected to continue to increase. Consequently the total will reach 28,459 in 2020. This represents a proportionate increase of 21% since 2015.
Special schools: Current pupil population & historic trend
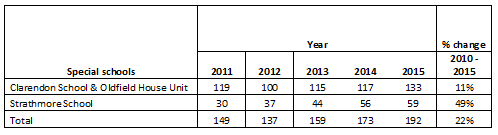
Two Special Schools are located in Richmond. Clarendon School is designated for moderate learning difficulties and autistic spectrum conditions for the age range 7 to 16. Strathmore School is designated for severe or profound and multiple learning difficulties including autistic spectrum conditions for the age range 7 to 19.
Table 5: Richmond special school population: Richmond 2011-2015
Source: Achieving for Children, Richmond local data
Notes:
- Numbers at Spring Term annually.
- Special schools with pupils aged 11 and older can specialise in 1 of the 4 areas of special educational needs; communication and interaction; cognition and learning; social, emotional and mental health; and sensory and physical needs. Schools can further specialise within these categories to reflect the special needs they help with such as autistic spectrum disorders, visual impairment or speech, language and communication needs. Taken from the Department of Education.
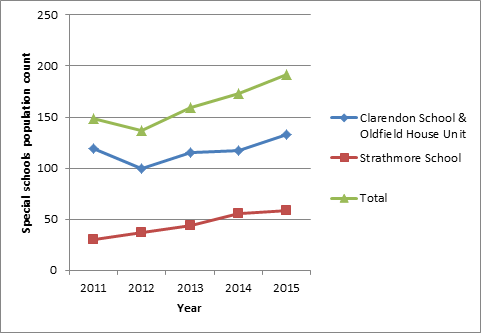
Figure 4: Special school population: Richmond 2011-2015
Source: Achieving for Children, Richmond local data
Notes:
- Numbers at Spring Term annually.
- Special schools with pupils aged 11 and older can specialise in 1 of the 4 areas of special educational needs; communication and interaction; cognition and learning; social, emotional and mental health; and sensory and physical needs. Schools can further specialise within these categories to reflect the special needs they help with such as autistic spectrum disorders, visual impairment or speech, language and communication needs. Taken from the Department of Education.
As shown in the Table and Figure above, the current total population of children in special schools in Richmond is 192.
Since 2011, it is estimated that the number of children attending special schools in Richmond has increased by 43 pupils (22%).
Special schools: Projected pupil population
Data is not available on the future expected pupil population of special schools.
Key findings – Population
Consideration of trends in the population of children and young people in Richmond and pupils attending Richmond schools found the following.
- Richmond’s resident population of children and young people (aged 0-24 years) grew by 7% over the period 2010-2015 to 56,800. This is projected to grow by a further 6% to 60,600 by 2020.
- The total number of pupils attending Richmond schools (includes all mainstream & special schools) grew by 14% over the period 2010-2015 to 34,857. Of these 16,621 are in primary school and 7,870 in secondary school in the state-funded sector (total 24,492).
- The total number of pupils attending special schools in Richmond grew by 22% over the period 2011-2015 to 192.
- The total number of pupils attending state-funded mainstream Richmond schools is projected to grow by a further 21% to 28,459 by 2020.
5 Local picture: Population characteristics influencing SEND needs
Introduction
A variety of population characteristics influence the levels and nature of SEND needs. These are multi-factorial, complex, and interrelated; and include a wide range of personal and family characteristics and disabilities.
Consequently the valid identification of population determinants of SEND need and accurate modelling of quantified estimates of expected service demand is challenging.
However, the available research suggests that a number of population characteristics are associated with levels of SEND need and current service provision. These include wider family circumstances (e.g. social & economic status, family problems), as well as the occurrence of specific disabilities (e.g. physical disabilities, learning disabilities, sensory & behavioural problems).
Where reliable population data is available its consideration provides insight into local SEND needs.
Analyses of the following data are reported the following sections.
Family circumstances
- Child poverty
- Free School meals
- Looked after children
- Children protection
- Children in need
- Maternal age and low birth weight
Disabilities
- Long-term health problems & disabilities limiting day to day activities
- Mental health problems
- Learning disabilities
- Physical disabilities
- Visual disabilities
- Disability living allowance
Current and historic data for these population characteristics are presented for Richmond and the selected comparators in the following sections.
Poverty
Levels of poverty in dependent children and young people may contribute to population SEND needs directly or increase the need for support in children with disabilities.
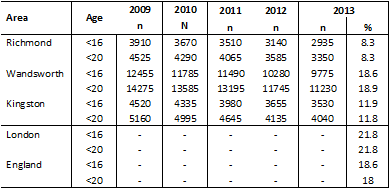
Table 6: % of dependent children (aged <16 & <20 years) in poverty (2009-2013)
Source: Personal tax credits: Children in low-income families local measure, from HM Revenue & Customs. Pre-2011 statistics are available from the National Archives; Child Poverty Statistics.
Figure 5: % of dependent children (aged <20 years) in poverty (2009-2013)
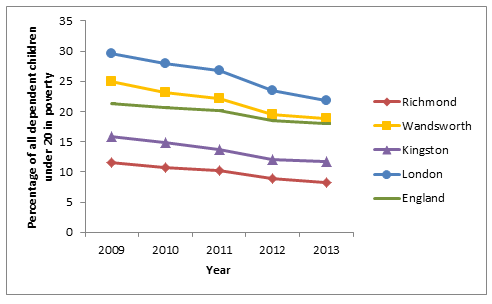
Source: Personal tax credits: Children in low-income families local measure, from HM Revenue & Customs.Pre-2011 statistics are available from the National Archives; Child Poverty Statistics.
As shown in the Table and Figure above, in 2013 dependent children and young people resident in Richmond (8.3%) are estimated to be less likely to be living in poverty than in the comparator areas. However, 2935 aged under 16 years and 3350 aged under 20 years, are estimated to live in poverty. Levels of poverty in these groups have declined in all areas over the period 2009 to 2013.
Free school meals
Population levels of pupils eligible and claiming free school meals is one a proxy measure providing insight into the levels of material deprivation which may contribute to population SEND need.
Table 7: Number & % of pupils eligible & claiming free school meals in maintained schools (2010-2015)
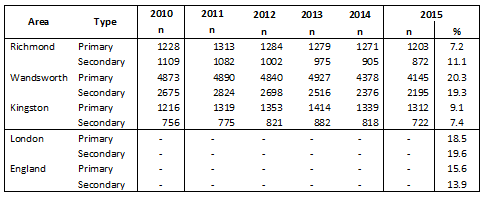
Source: Schools, pupils and their characteristics, from the Department for Education.
Figure 6: % of pupils eligible & claiming free school meals in nursery & primary schools (2010-2015)
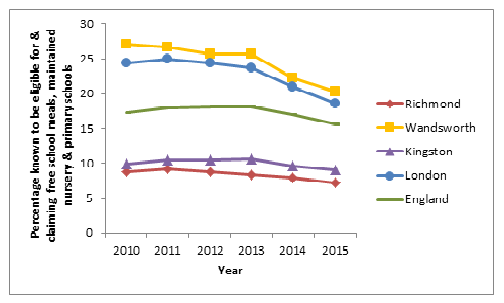
Source: Schools, pupils and their characteristics, from the Department for Education.
Figure 7: % of pupils eligible & claiming free school meals in maintained secondary schools (2010-2015)
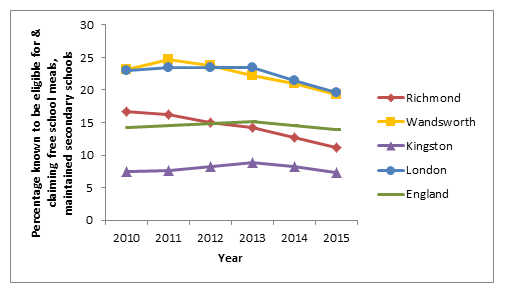
Source: Schools, pupils and their characteristics, from the Department for Education.
Currently, 1,203 (7%) primary pupils and 872 (11%) secondary pupils in Richmond schools are eligible for and claim free school meals.
Proportionately, levels of free school meals in Richmond are lower than in the comparator areas, except in the case of secondary school pupils in Kingston.
Over the period 2010-2015, Richmond and the local comparator areas have experienced declining levels of free school meals.
Looked after children
Looked After Children are recognised as a potentially vulnerable in a range of respects (e.g. parenting, emotional development), and as such are more likely to have SEND needs.
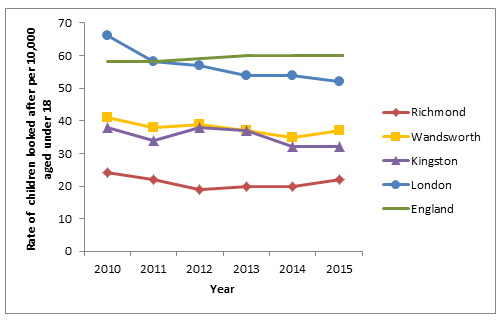
Table 8: Number & rate/10,000 of looked after children (aged <17) 2010-2015
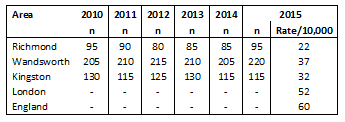
Source: Children looked after in England, including adoption, from the Department of Education.
Figure 8: Rate/10,000 of looked after children (aged <17) 2010-2015
Source: Children looked after in England, including adoption, from the Department of Education.
The table & figure above show that there are currently 95 Looked After Children in Richmond, compared to 220 in Wandsworth and 115 in Kingston. The equivalent rates show that levels of Looked After Children in Richmond are substantially lower than in Wandsworth and Kingston.
Over the period 2010-2015, the rates of Looked After Children in Richmond, Wandsworth, Kingston and England have remained broadly stable, while rates in London have fallen.
Child protection
Children subject to child protection plans are also recognised as vulnerable (e.g. parenting, emotional development), and potentially more likely to have SEND needs.
Table 9: Number & rate/10,000 of children (aged <18) who were the subject of a child protection plan 2011-2014
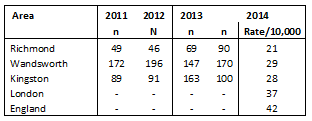
Source: Characteristics of children in need, from the Department of Education
Figure 9: Rate/10,000 of children (aged <18) who were the subject of a child protection plan 2011-2014
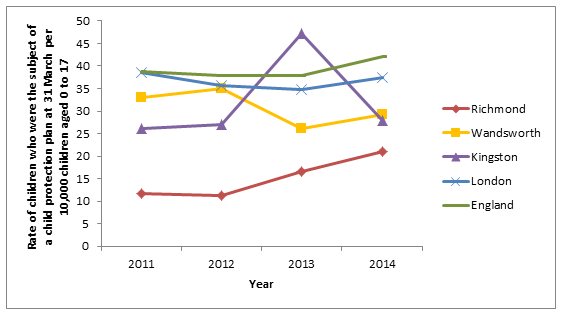
Source: Characteristics of children in need, from the Department of Education.
The table & figure above show that in 2014 there were 90 Children who were the subject of a protection plan in Richmond, compared to 170 in Wandsworth and 100 in Kingston. The equivalent rates show that levels of Child Protection in Richmond are substantially lower than in Wandsworth and Kingston.
The figure shows that in contrast to Wandsworth and Kingston, over the period 2010-2014, the rates of Child Protection in Richmond have risen substantially.
Children in need
Local Authorities are obliged to provide social services to children assessed as in need following referral to them (Section 17, Children Act 1989), including family support, adoption, leaving care, and disability services (inc. social care, educational, & health support).
Given their specific problems, children assessed as being in need also provides insight into potential levels of need for SEND services.
Table 10: Total annual number & rate/10,000 of children in need (aged <18) 2011-2014
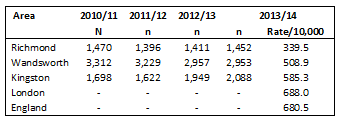
Source: Characteristics of children in need, from the Department of Education.
Figure 10: Rate/10,000 of children (aged <18) in need 2010/11 – 2013/14
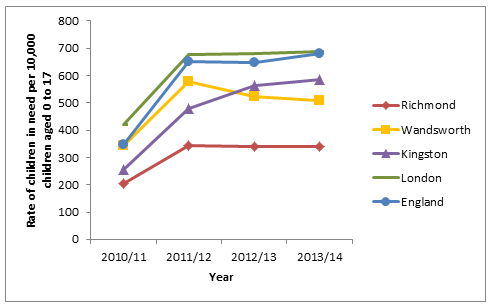
Source: Characteristics of children in need, from the Department of Education.
The table & figure above show that in 2014 there were 1452 Children In Need in Richmond, compared to 2953 in Wandsworth and 2088 in Kingston. The equivalent rates per 10,000 resident population show that levels of Children In Need in Richmond around half those in Wandsworth and Kingston, and remained steady over the period 2011/12 – 2013/14.
Other data, shown in the figure below considers levels of disability among children assessed as being in need.
Figure 11: % children in need (aged <18) recorded as experiencing & not experiencing disabilities: Richmond (at 21 March 2014)
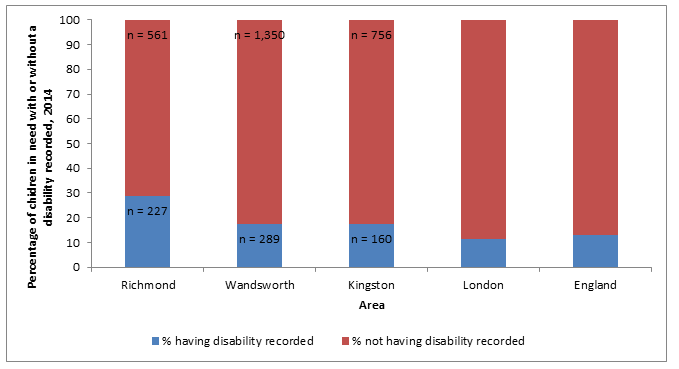
Source: Characteristics of children in need, from the Department of Education.
This shows that a higher proportion (28% n=227)) of Children in Need in Richmond are recorded as having disabilities than in the comparator areas.
In addition, details of the types of disabilities are also collected of children assessed as in need with disabilities. As shown in the figure below, this provides more detailed insight into the levels of particular disabilities locally, which potentially affect the levels and particular characteristics of SEND need in the Richmond population.
Figure 12: % of children in need (aged <18) experiencing disabilities by category: Richmond (at 21 March 2014)
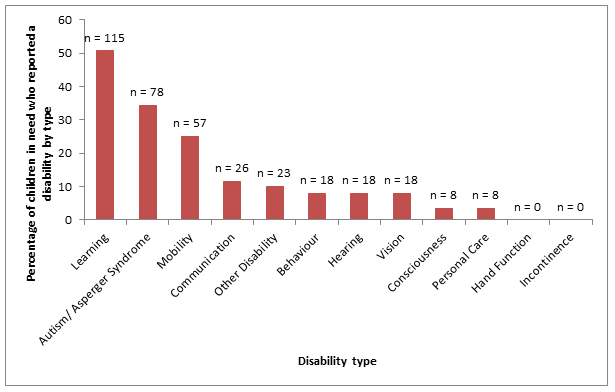
Source: Characteristics of children in need, from the Department of Education.
Note: Children can be recorded as having multiple types of disability. Consequently the percentage total is >100%.
The analysis shows that the most common types of disability among children in need in Richmond, are learning disabilities (51% n=115), autism/Asperger syndrome (34% n=78) and mobility problems (25% n=57).
Finally, details of the SEND services received by children in need with disabilities are also recorded.
Figure 13: % of children in need (aged 5 to 16) eligible for: No SEN, SEN support, and Statements of SEN (at 31 Mar 2014)
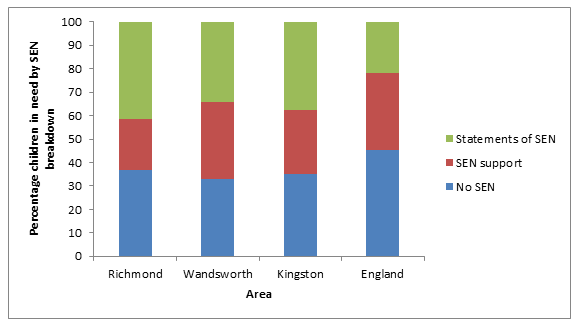
Source: Characteristics of children in need, from the Department of Education.
The analysis shows that compared to the other area, in Richmond a higher proportion of children in need with disabilities receive a SEN Statement (41% n=140) and a lower proportion receive SEN Support services (22% n=74).
Maternal age and low birth weight
Maternal age is a pre-determinant of low birth weight and pre-term rates, with those at extreme ends of the maternal age spectrum having a higher prevalence of low birth weight or pre-term birth.
Low birth weight increases the risk of childhood mortality and of developmental problems for the child and is associated with poorer health in later life. The risk of special educational needs increases with moderately decreased birth weight. Although children of very low birth weight have a much higher rate of special educational needs than other children, they still make up only a small percentage of all children with special educational needs.
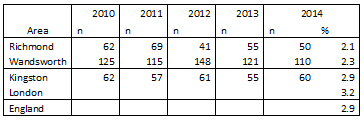
Table 11: Number and rate of births per 1,000 women aged under and over 35, 2010 to 2014
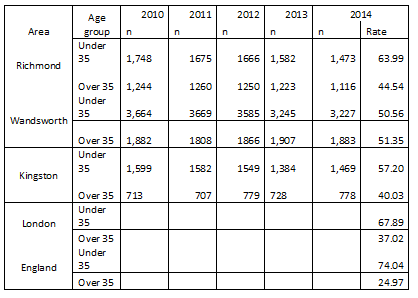
Source: Births by area of usual residence, from the Office of National Statistics.
Figure 14: Rate per 1,000 women aged over 35 at birth, 2010 to 2014
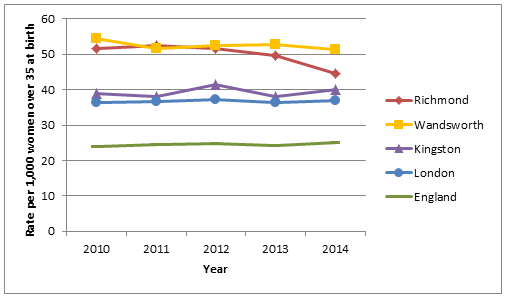
Source: Births by area of usual residence, from the Office of National Statistics.
The table & figure above show that the rate per 1,000 women over 35 at birth in Richmond is almost double that for England. In addition, Richmond has a lower rate compared to Wandsworth but a higher rate than Kingston.
Richmond has been showing a decreasing trend in the rate of births per 1,000 women over the age of 35 since 2012. However there has also been a decrease in the rate of births per 1,000 women aged 15-49 since 2012 as shown in the table & figure directly below.
Table 12: Rate of births per 1,000 women aged 15-49, 2010 to 2014
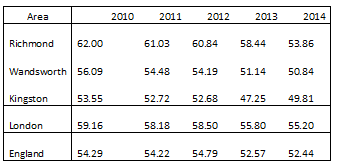
Source: Births by area of usual residence, from the Office of National Statistics.
Figure 15: Rate of births per 1,000 women aged 15-49, 2010 to 2014
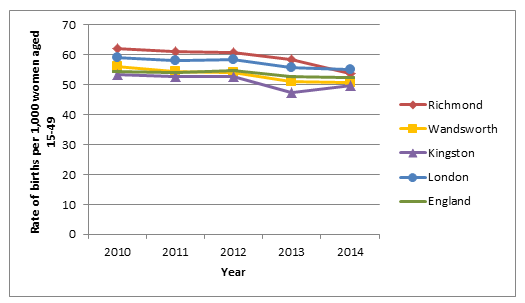
Source: Births by area of usual residence, from the Office of National Statistics.
The Table below shows that 43% of all births in Richmond are to women aged over 35, which is higher than all the comparators.
Table 13: Number & % of births to women aged under and over 35, 2010 to 2014
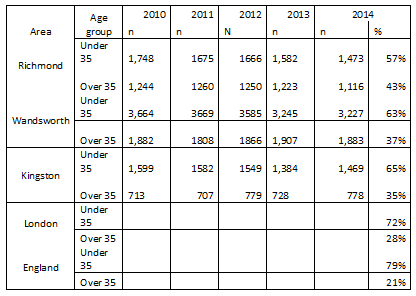
Source: Births by area of usual residence, from the Office of National Statistics.
Figure 16: % of births to women aged over 35, 2010 to 2014
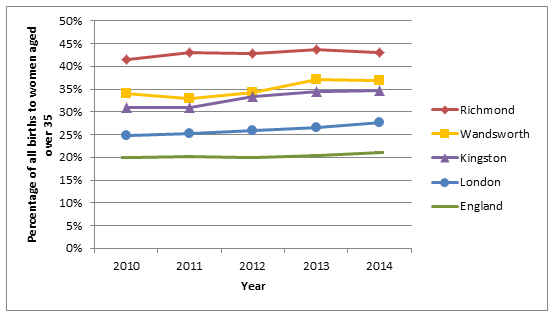
Source: Births by area of usual residence, from the Office of National Statistics.
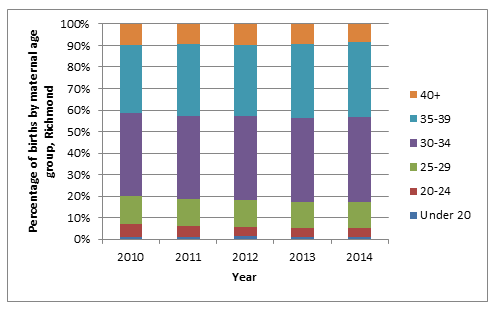
Table 14: % of births by maternal age group, 2010 to 2014, Richmond
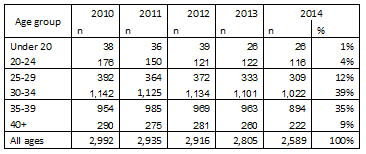
Source: Births by area of usual residence, from the Office of National Statistics.
Figure 17: % of births by maternal age group, 2010 to 2014, Richmond
Source: Births by area of usual residence, from the Office of National Statistics.
The largest proportion of births for Richmond is for the 30 to 34 age group (39%). However there has been a slight increase in the percentage of births in the 35 to 39 age group, from 32% in 2010 and 35% in 2014.
Table 15: Number of live births with recorded birth weight under 2500g and a gestational age of at least 37 weeks
Source: Births with low birth weight, modified version 1st Dec 2015, Greater London Authority – London datastore .
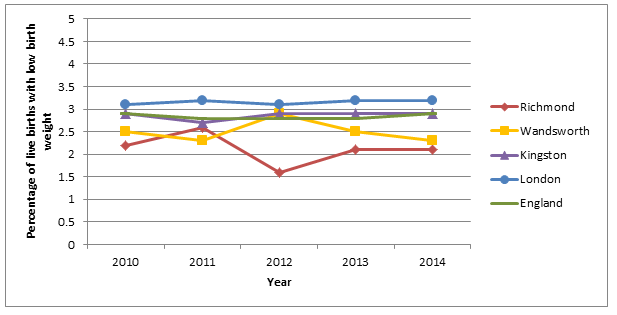
Figure 18: % of live births with recorded birth weight under 2500g and a gestational age of at least 37 complete weeks
Source: Births with low birth weight, modified version 1st Dec 2015, Greater London Authority – London datastore .
Richmond has the lowest percentage of live births with a low birth weight than the comparators. However, this data only shows births of gestational age of at least 37 complete weeks. Preterm births (under 37 weeks) are more likely to have a low birth weight and women older than age 35 are at risk of having preterm infants because they are more likely to have other conditions (such as blood pressure and diabetes) which can cause complications requiring preterm delivery.
Long-term health problems & disability
Levels of self-reported limitations on day-to-day activity in children and young people due to long-term health problems or disabilities also provides a direct insight in to likely levels of population SEND need.
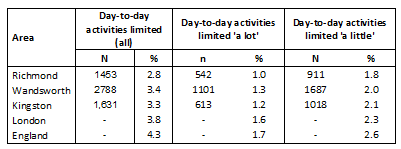
Table 16: Number & % of children & young people (aged <25) with day-to-day limited activities 2011
Source: Nomis official labour market statistics, 2011 census data, from the Office for National Statistics.
Figure 19: % of children & young people (aged <25) with day-to-day limited activities 2011
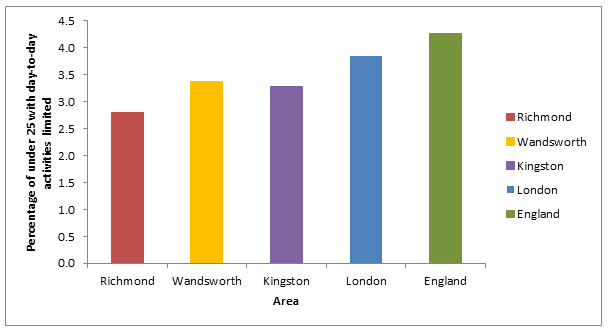
Source: Nomis official labour market statistics, 2011 census data, from the Office for National Statistics.
The table & figure above show that in 2011 levels of limitations of day-to-day activity in children and young people due to long-term health problems or disabilities in Richmond were lower than in the other areas in all levels of limitations. However, it remains that in total 1,453 Richmond residents suffered such limitations.
Estimated prevalence of mental health problems
Local service used data for children and young people with mental health problems was not used in the project due to limitations on timescales. However, estimated levels of prevalence, based on research elsewhere, provides insight in to likely levels of population SEND need.
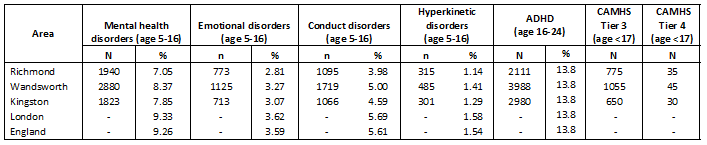
Table 17: Estimated number & % of children with mental health problems
Source: Children’s and Young People’s Mental Health and Wellbeing, Public Health Profiles, from Public Health England.
Notes:
Mental health disorders
Definition: This is an estimate of the percentage of children aged 5-16 who have any mental health disorders based on the age, sex and socio-economic classification of children resident in the area.
Numerator: Number of children aged 5-16 estimated to have any mental health disorders based on the prevalence from the ONS survey Mental health of children and young people in Great Britain (2004) adjusted for age, sex and socio-economic classification.
Denominator: Number of children aged 5-16
Emotional disorders
Definition: This is an estimate of the percentage of children aged 5-16 who have emotional disorder (anxiety disorders and depression) based on the age, sex and socio-economic classification of children resident in the area.
Numerator: Number of children aged 5-16 estimated to have emotional disorders (anxiety disorders and depression) based on the prevalence from the ONS survey Mental health of children and young people in Great Britain (2004) adjusted for age, sex and socio-economic classification.
Denominator: Number of children aged 5-16
Conduct disorders
Definition: This is an estimate of the percentage of children aged 5-16 who have conduct disorders based on the age, sex and socio-economic classification of children resident in the area.
Numerator: Number of children aged 5-16 estimated to have conduct disorders based on the prevalence from the ONS survey Mental health of children and young people in Great Britain (2004) adjusted for age, sex and socio-economic classification.
Denominator: Number of children aged 5-16
Hyperkinetic disorders
Definition: This is an estimate of the percentage of children aged 5-16 who have hyperkinetic disorders based on the age, sex and socio-economic classification of children resident in the area.
Numerator: Number of children aged 5-16 estimated to have hyperkinetic disorders based on the prevalence from the ONS survey Mental health of children and young people in Great Britain (2004) adjusted for age, sex and socio-economic classification.
Denominator: Number of children aged 5-16
ADHD
Definition: The estimated number of people aged 16-24 with attention deficit hyperactivity disorder (ADHD) based on applying the estimated prevalence percentage (13.8%) to the resident population aged 16-24. ADHD is a developmental disorder consisting of core dimensions of inattention, hyperactivity and impulsiveness.
Numerator: Number of young people 16 – 24 estimated to have ADHD based on the prevalence from the APMS Survey (2007).
Denominator: None
Tier 3 & 4 CAMHS
Defintion: Estimates of the numbers of children aged 17 years and under who may experience mental health problems appropriate to a response from CAMHS
Numerator: Estimates of the numbers of children aged 17 years and under who may experience mental health problems appropriate to a response from CAMHS Tiers 1 to 4 in the local authority as per Kurtz, Z. (1996) Treating children well: a guide to using the evidence base in commissioning and managing services for the mental health of children and young people. London. Mental Health Foundation.
Source of numerator: 2012 mid year population estimates are from the Office for National Statistics. CCG General Practice (GP) registered patient counts (2012) from the Health and Social Care Information Centre.
The table above shows that estimated levels of mental health problems in Richmond are in general proportionately lower than in the other areas. However, it remains that in total 1,940 residents aged 5-16 years are estimated to experience a mental health disorder, 773 emotional disorders, 1095 conduct disorders, and 315 hyperkinetic disorders. Also, 2111 aged 16-24 years are estimated to experience ADHD. Finally, in those aged <17 years, 775 are expected to need Tier 3 CAMHS services and 35 Tier 4 CAMHS.
Estimated prevalence of learning disabilities
Local service used data for children and young people with learning disabilities was not used in the project due to limitations on timescales. However, estimated levels of prevalence, based on research elsewhere, provides insight in to likely levels of population SEND need.
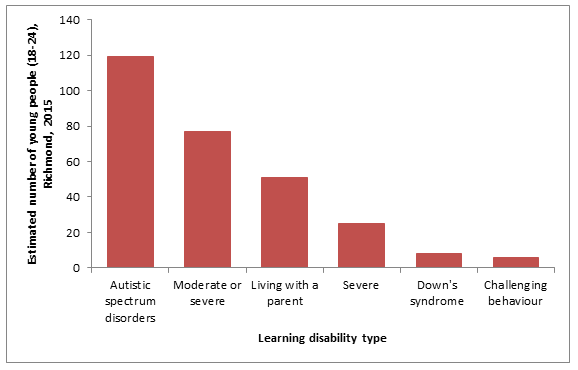
Figure 20: Estimated number of young people (age 18-24) with learning disabilities in Richmond 2015
Source: Projecting Adult Needs and Service Information (PANSI)
Notes:
Learning disability
These predictions are based on prevalence rates in a report by Eric Emerson and Chris Hatton of the Institute for Health Research, Lancaster University, entitled Estimating Future Need/Demand for Supports for Adults with Learning Disabilities in England, June 2004. The authors take the prevalence base rates and adjust these rates to take account of ethnicity (i.e. the increased prevalence of learning disabilities in South Asian communities) and of mortality (i.e. both increased survival rates of young people with severe and complex disabilities and reduced mortality among older adults with learning disabilities). Therefore, figures are based on an estimate of prevalence across the national population; locally this will produce an over-estimate in communities with a low South Asian community, and an under-estimate in communities with a high South Asian community.
Prediction rates have been applied to ONS population projections of the 18-64 population in the years 2011 and 2021 and linear trends projected to give estimated numbers predicted to have a mild, moderate or severe learning disability, to 2030.
Learning disability – severe
These predictions are based on Estimating the prevalence of severe learning disability in adults – working paper 1, July 2009, Institute of Public Care, using LD registers from Sheffield and Leicestershire. Both sets of registers held information about the number of people with complex or severe learning disabilities and the number of people living at home with their parents. From the information on the individual databases, prevalence rates for people with complex or severe learning disabilities were calculated by age bands.
The above prevalence rates have been applied to the administrative rate to give estimated numbers predicted to have a severe or complex learning disability, to 2030.
Living with a parent
This table is based on a set of prevalence rates for adults with a learning disability living with a parent, established as a proportion of those known via learning disability registers (the administrative rate as established by Eric Emerson and Chris Hatton of the Institute for Health Research, Lancaster University, entitled Estimating Future Need/Demand for Supports for Adults with Learning Disabilities in England, June 2004).
These predictions are based on Estimating the prevalence of severe learning disability in adults – working paper 1, July 2009, Institute of Public Care, using LD registers from Sheffield and Leicestershire. Both sets of registers held information about the number of people with complex or severe learning disabilities and the number of people living at home with their parents. From the information on the individual databases, prevalence rates for people living at home were calculated by age bands.
The above prevalence rates have been applied to the administrative rate to give estimated numbers of people with a moderate or severe learning disability predicted to be living with a parent, to 2030.
Down syndrome
The prevalence rate for this table is based on two studies which put the prevalence of Down’s syndrome at between 5.9 per 10,000 general population (Mantry et al) and 6.6 per 10,000 live births (the Clinical and Health Outcomes Knowledge Base). The mean of these rates, 6.25 per 10,000 population, has been used.
Mantry, D., et al, The prevalence and incidence of mental ill-health in adults with Down syndrome, Journal of Intellectual Disability Research, 52(2), February 2008, pp.141-155 cites a prevalence rate of Down’s syndrome for the 16 years and over population of 5.9 per 10,000 general population.
The Clinical and Health Outcomes Knowledge Base is a source of information on health outcomes generated by NCHOD (the National Centre for Health Outcomes Development). In 2005, the number and prevalence of live and still born babies in England with Down’s syndrome was 410 or 6.6 per 10,000 live births. Copyright 2008, re-used with the permission of the Health and Social Care Information Centre. All rights reserved.
The prevalence rate has been applied to ONS population projections of the 18 to 64 population to give estimated numbers predicted to have Down’s syndrome to 2030.
Note that the average life expectancy for people with Down’s syndrome is approximately 59 years (Glasson et al, 2002) and therefore numbers for older age groups should be treated with caution.
Challenging behaviour
The prevalence rate for people with a learning disability displaying challenging behaviour is 0.045% of the population aged 5 and over.
The prevalence rate is based on the study Challenging behaviours: Prevalence and Topographies, by Lowe et al, published in the Journal of Intellectual Disability Research, Volume 51, in August 2007.
In total, 4.5 people per 10,000 of the population aged 5 and over were rated as seriously challenging (representing approximately 10% of the learning disability population). The most prevalent general form of challenging behaviour was ‘other difficult/disruptive behaviour’, with non-compliance being the most prevalent challenging behaviour.
The prevalence rate has been applied to ONS population projections to give estimated numbers with a learning disability predicted to display challenging behaviour, to 2030.
Autistic spectrum
The information about ASD is based on Autism Spectrum Disorders in adults living in households throughout England: Report from the Adult Psychiatric Morbidity Survey 2007 was published by the Health and Social Care Information Centre in September 2009.
The prevalence of ASD was found to be 1.0% of the adult population in England, using the threshold of a score of 10 on the Autism Diagnostic Observation Schedule to indicate a positive case. The rate among men (1.8%) was higher than that among women (0.2%), which fits with the profile found in childhood population studies.
The report Prevalence of disorders of the autism spectrum in a population cohort of children in South Thames: the Special Needs and Autism Project (SNAP), Baird, G. et al, The Lancet, 368 (9531), pp. 210-215, 2006. found that 55% of those with ASD have an IQ below 70%.
The National Autistic Society states that ‘estimates of the proportion of people with autism spectrum disorders (ASD) who have a learning disability, (IQ less than 70) vary considerably, and it is not possible to give an accurate figure. Some very able people with ASD may never come to the attention of services as having special needs, because they have learned strategies to overcome any difficulties with communication and social interaction and found fulfilling employment that suits their particular talents. Other people with ASD may be able intellectually, but have need of support from services, because the degree of impairment they have of social interaction hampers their chances of employment and achieving independence.’
The prevalence rates have been applied to ONS population projections of the 18 to 64 population to give estimated numbers predicted to have autistic spectrum disorder to 2030.
As shown in the figure above available estimates that in Richmond there are a total of 77 residents aged 18-24 years with a moderate to severe learning disability, 25 with a severe learning disability, 51 who live with their parents, 8 with Down’s Syndrome, 6 with challenging behaviour, and 119 with autistic spectrum disorder.
Estimated prevalence of physical disabilities
Local service used data for children and young people with physical disabilities was not used in the project due to limitations on timescales. However, estimated levels of prevalence, based on research elsewhere, provides insight in to likely levels of population SEND need.
Figure 21: Estimated number of young people (age 18-24) with physical disabilities: Richmond 2015
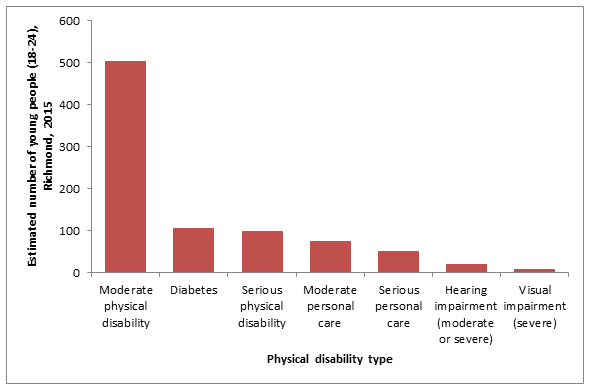
Source: Projecting Adult Needs and Service Information (PANSI)
Notes:
Moderate or serious physical disability
This table is based on the prevalence data for moderate and serious disability by age and sex included in the Health Survey for England, 2001, edited by Madhavi Bajekal, Paola Primatesta and Gillian Prior.
The prevalence rates have been applied to ONS population projections of the 18 to 64 population to give estimated numbers predicted to have a moderate or serious physical disability to 2030.
Personal care
This table is based on the prevalence data on adults with physical disabilities requiring personal care by age and sex in the Health Survey for England, 2001. These include: getting in and out of bed, getting in and out of a chair, dressing, washing, feeding, and use of the toilet. A moderate personal care disability means the task can be performed with some difficulty; a severe personal care disability means that the task requires someone else to help.
This table is based on the prevalence data on adults with physical disabilities requiring personal care by age and sex in the Health Survey for England, 2001. These include: getting in and out of bed, getting in and out of a chair, dressing, washing, feeding, and use of the toilet. A moderate personal care disability means the task can be performed with some difficulty; a severe personal care disability means that the task requires someone else to help.
Diabetes
These prevalence rates are taken from the Health Survey for England 2006 Volume 1 Cardiovascular Disease and Risk Factors in Adults, The NHS Information Centre, 2008. The study provides prevalence data by age and gender, and by type of diabetes. The most significant factors for the onset of Type 2 diabetes are age and weight.
The prevalence rates have been applied to ONS population projections for the 18-64 population to give estimated numbers predicted to have doctor-diagnosed diabetes, projected to 2030.
Visual impairment
This above table is based on The prevalence of visual impairment in the UK, A review of the literature, by Tate, Smeeth, Evans, Fletcher, Owen and Rudnicka, RNIB, 2005. They report that “Most studies have been done in the older population and there is a scarcity of data in younger adult age groups in the UK. A review by Nissen et al of epidemiological studies performed in Western Europe, North America and Australia covering the age group 20 to 59 years found the prevalence of blindness was 0.08 and of visual acuity 6/24 to 6/48 was 0.07%. These figures agree well with the prevalence of registrations in a similar age range and we conclude that registration data provide reasonably accurate estimates of the prevalence of serious vision impairment in the younger adult age groups”. The RNIB suggest a lower figure of 1 in 500 as an estimated basis of people who would be registerable. The Tate study also argues, as do others, that estimates of less than severe visual impairment are unreliable with a high degree of variance reported in self report studies. A mean of the three figures, 0.065%, has been used as an estimate of the numbers of people with a severe visual impairment.
The prevalence rates have been applied to ONS population projections for the 18-64 population to give estimated numbers predicted to have a serious visual impairment and require help with daily activities, projected to 2030.
Hearing impairment
This table is based on the combined prevalence from two studies: Adrian Davis (Ed.), Hearing in Adults (1995), Whurr Publishers Limited, and Adrian Davis et al, Health Technology Assessments 11(42):1-294 (October 2007).
Hearing loss and deafness is usually measured by finding the quietest sounds someone can hear using tones with different frequencies, which are heard as different pitches. The person being tested is asked to respond, usually by pressing a button, when they can hear a tone and the level of the tone is adjusted until they can just hear it. This level is called the threshold. Thresholds are measured in units called dBHL: dB stands for ‘decibels’ and HL stands for ‘hearing level’. Anyone with thresholds between 0 and 20 dBHL across all the frequencies is considered to have ‘normal’ hearing. The greater the threshold level is in dBHL the worse the hearing loss.
Moderate deafness: People with moderate deafness have difficulty in following speech without a hearing aid. The quietest sounds they can hear in their better ear average between 35 and 49 decibels.
Severe deafness: People with severe deafness rely a lot on lipreading, even with a hearing aid. BSL may be their first or preferred language. The quietest sounds they can hear in their better ear average between 50 and 94 decibels.
Profound deafness: People who are profoundly deaf communicate by lipreading. BSL may be their first or preferred language. The quietest sounds they can hear in their better ear average 95 decibels or more.
However, as shown in the figure above it is estimated that in Richmond there are a total of 504 residents aged 18-24 years with a moderate physical disability, 98 with a serious physical disability, 74 requiring moderate personal care, 49 requiring serious personal care, 105 with diabetes, 8 with serious visual impairment, and 19 with moderate or severe hearing impairment.
Visual disabilities
Children with visual disabilities may also be in need of SEND services.
Table 18: Number & rate/10,000 children & young people (aged <18) with visual disabilities 2008-2014
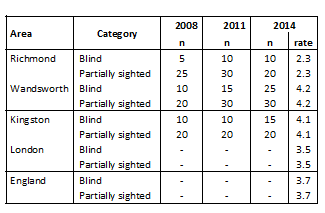
Source: Registered Blind and Partially Sighted People, from the Health & Social Care Information Centre (HSCIC).
Note 1: Numbers rounded to nearest 5
Note 2: This publication contains detailed statistics on adults and children registered, with councils with social services responsibilities in England, as being blind or partially sighted. The data are compiled from the triennial SSDA 902 return submitted by councils to the Health and Social Care Information Centre (HSCIC).
People that have a Certificate of Vision Impairment from an ophthalmologist choose whether or not to be included in their local authority’s register of blind or partially sighted people; registration is not automatic. Those that register become eligible for certain concessions. This means that not everybody that has been certified as having a vision impairment is recorded on a local authority register. In addition, some local authorities have informed us that there are difficulties in providing some elements of these data. For these reasons the data in this publication cannot be considered as definitive numbers of blind and partially sighted people.
Figure 22: Rate/10,000 children & young people (aged <18) registered blind 2008-2014
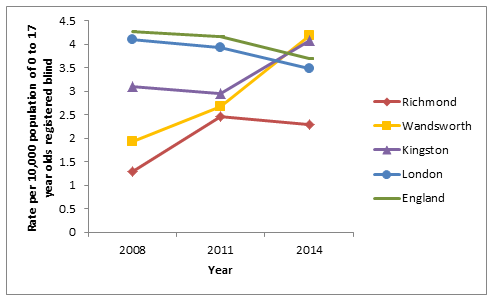
Source: Registered Blind and Partially Sighted People, from the Health & Social Care Information Centre (HSCIC).
Notes: See notes in table above.
Figure 23: Rate/10,000 children & young people (aged <18) registered partially sighted 2008-2014
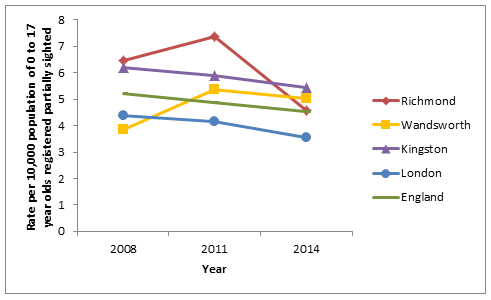
Source: Registered Blind and Partially Sighted People, from the Health & Social Care Information Centre (HSCIC). Notes: See notes in chart above.
The table above shows that estimated levels of visual disability among children in Richmond are in general lower than in the other areas. However, it remains that 10 children are blind and 20 partially sighted.
Disability living allowance
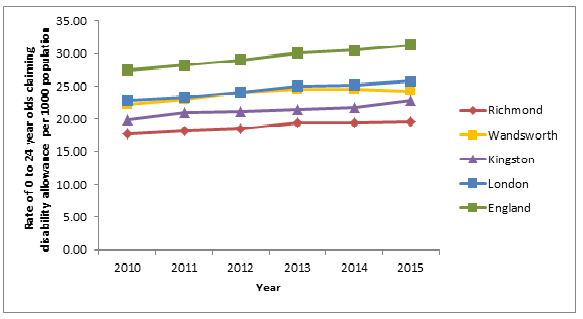
The reported levels and numbers of children and young people receiving Disability Living Allowance (DLA) provides an additional insight in to likely levels of population SEND need.
Table 19: Number & rate/1000 children & young people (aged <25) receiving DLA 2010-2015
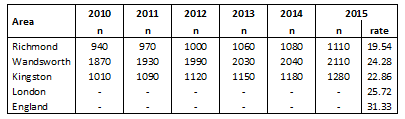
Source: Department of Work & Pensions (DWP) benefits, nomis official labour market statistics, from the Office of National statistics.
Figure 24: Rate/1000 children & young people (aged <25) receiving DLA 2010-2015
Source: Department of Work & Pensions (DWP) benefits, nomis official labour market statistics, from the Office of National statistics.
The table and figure above shows that the reported level of children and young people receiving DLA is lower in Richmond than in the other areas. However, it remains that rates have risen over the period 2010 to 2015, and that in total 1,110 were receiving DLA in 2015.
Key findings – Population characteristics affecting SEND need
A variety of population characteristics influence the levels and nature of SEND needs. These are multi-factorial, complex, and interrelated; and include a wide range of personal and family characteristics and disabilities. The analysis found the following.
- Dependent children and young people resident in Richmond are less likely to be living in poverty than other areas.
- Pupils in Richmond schools are less likely to be eligible and claiming free school means than in other areas.
- Richmond has lower levels of Looked After Children than other areas.
- Richmond has lower levels of children subject to child protection plans than other areas. However, rates have risen in recent years.
- Richmond has lower levels of Children in Need than other areas. However, in Richmond a higher proportion of those in need appear to have disabilities.
- Children and young people in Richmond are less likely to have limitations of day-to-day activities due to long-term health problems or disabilities than in other areas.
- Estimates suggest that children in Richmond experience less mental health problems than other areas.
- Children in Richmond are less likely to experience visual disabilities than other areas.
- Children and young people in Richmond are less likely to receive Disability Living Allowance than other areas.
6 Local Picture: Children receiving SEND services
Introduction
The following sections consider the numbers and needs of children attending all school types, primary schools, secondary schools and special schools (where data allows) in Richmond receiving SEN services. Current and historic data for Richmond and the selected comparators are in the following sections.
Unfortunately appropriate information on relevant services being provided to young people (aged >17 years) with disabilities, and children and young people assigned an Education Care and Health Plan (ECHP) is less easily available and consequently is not reported.
Numbers & percentages of children receiving SEN services
The following sections report the numbers of children being catered for with the main levels of SEN services, compare levels (% of all pupils) between areas, and set-out historic trends in Richmond schools.
All Schools
This section reports on findings including all school types (see definition below).
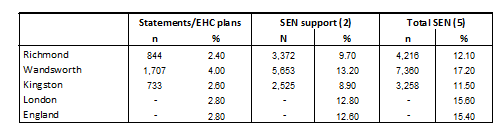
Table 20: Number & % of children receiving SEN services: All schools (at Jan 2015)
Source: Special educational needs in England: January 2015, from the Department for Education, first published July 2015.
Notes:
All schools (1) Includes maintained and direct grant nursery schools, maintained primary and secondary schools, city technology colleges, academies, special schools, pupil referral units and independent schools.
(2) SEN support includes school action and school action plus.
The table above shows that in all types of schools in Richmond there are 844 children with SEN statements, representing 2.4% of total pupils, a similar level to the other areas except Wandsworth (4%); and 3372 children receiving SEN support, representing 9.7%, a lower level than in the other areas except Kingston (8.9%).
When comparing total SEN, Richmond (12.1%) has a lower level of SEN pupils than the other areas except Kingston (11.5%).
Figure 25: % of children receiving SEN services: All schools (2010-2015)
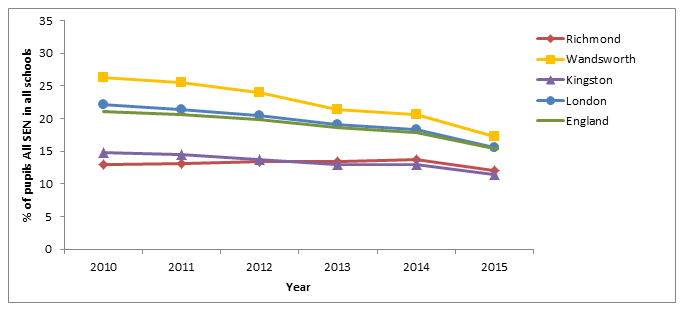
Source: Special educational needs in England, from the Department for Education.
The figure above shows that since 2010 the percentage of all SEN pupils in Richmond in all types of schools has remained roughly stable, whereas the other areas have experienced a decline.
Figure 26: % of children receiving SEN service types: All schools – Richmond (2010-2015)
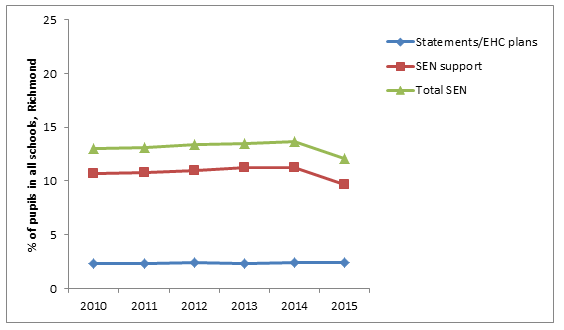
Source: Special educational needs in England, from the Department for Education.
The figure above examines trends in the levels of different types of SEN services in all school types in Richmond in more detail. It shows that since 2010 the percentage of SEN statements has remained steady, while between 2014 and 2015 there was a small decline in the percentage of pupils receiving SEN support services.
State funded primary schools
This section reports on findings for state funded primary schools (see definition below).
Table 21: Number & % of children receiving SEN services: Primary schools (at Jan 2015)
Source: Special educational needs in England: January 2015, from the Department for Education, first published July 2015.
Notes:
(4) State-Funded primary schools: Includes middle schools as deemed and primary academies
(2) SEN support includes school action and school action plus.
The table above shows that in primary schools in Richmond there are 342 children with SEN statements, representing 2.1% of total pupils, a higher level to the other areas; and 1343 children receiving SEN support, representing 8.1%, a lower level than in the other areas.
When comparing total SEN, Richmond (10.1%) has a lower level of SEN pupils than the other areas.
Figure 27: % of children receiving SEN services: Primary schools (2010-2015)
Source: Special educational needs in England, from the Department for Education.
The figure above shows that since 2010 the percentage of all SEN pupils in primary schools in Richmond has seen a shallow decline compared to steeper declines in the other areas.
Figure 28: % of children receiving SEN service types: Primary schools – Richmond (2010-2015)
Source: Special educational needs in England, from the Department for Education.
The figure above examines trends in the levels of different types of SEN services in Richmond in primary schools in more detail. It shows that since 2010 the percentage of SEN statements has risen very slightly, and the percentage receiving SEN support services shows a shallow decline.
State funded secondary schools
This section reports on findings for state funded secondary schools (see definition below).
Table 22: Number & % of children receiving SEN services: Secondary schools (at Jan 2015)
Source: Special educational needs in England: January 2015, from the Department for Education, first published July 2015.
Notes:
(6) State-Funded Secondary schools: Includes middle schools as deemed, city technology colleges and secondary schools.
(2) SEN support includes school action and school action plus.
The table above shows that in secondary schools in Richmond there are 286 children with SEN statements, representing 3.6% of total pupils, a higher level to the other areas; and 1014 children receiving SEN support, representing 12.9%, a similar level to England and London, but lower than Wandsworth and much higher than Kingston. A similar pattern is also seen compared to the other areas when examining percentages of total SEN in secondary schools.
Figure 29: % of children receiving SEN services: Secondary schools (2010-2015)
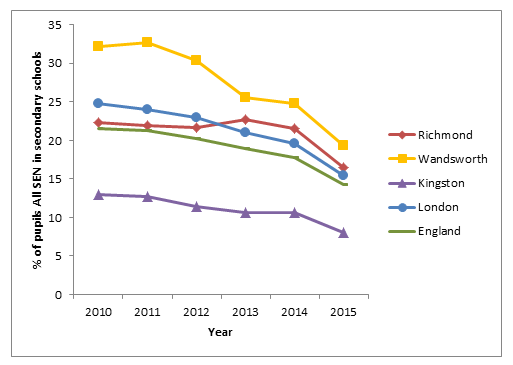
Source: Special educational needs in England, from the Department for Education.
The figure above shows that since 2010 the percentage of all SEN pupils in secondary schools has declined steadily in all areas.
Figure 30: % of children receiving SEN service types: Secondary schools – Richmond (2010-2015)
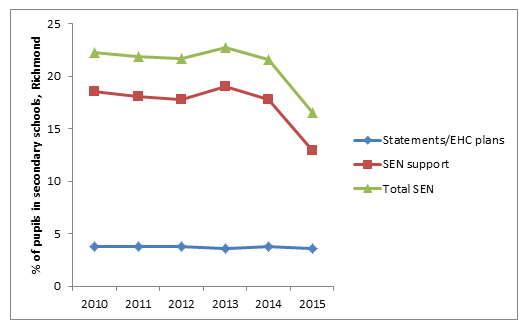
Source: Special educational needs in England, from the Department for Education.
The figure above examines trends in the levels of different types of SEN services in Richmond in secondary schools in more detail. It shows that since 2010 the percentage of SEN statements has remained steady, and the percentage receiving SEN support services has declined substantially since 2013.
Needs of children receiving SEN services
The following sections report details of the needs of Richmond school pupils being catered for by SEN services. This includes rates per 1000 school pupils and numbers for each type of need, and historic trends in Richmond schools.
The findings are presented for primary, secondary and special schools (see figure notes).
Figure 31: Rate per thousand school population of SEN pupils by primary type of need: Primary schools – Richmond 2015
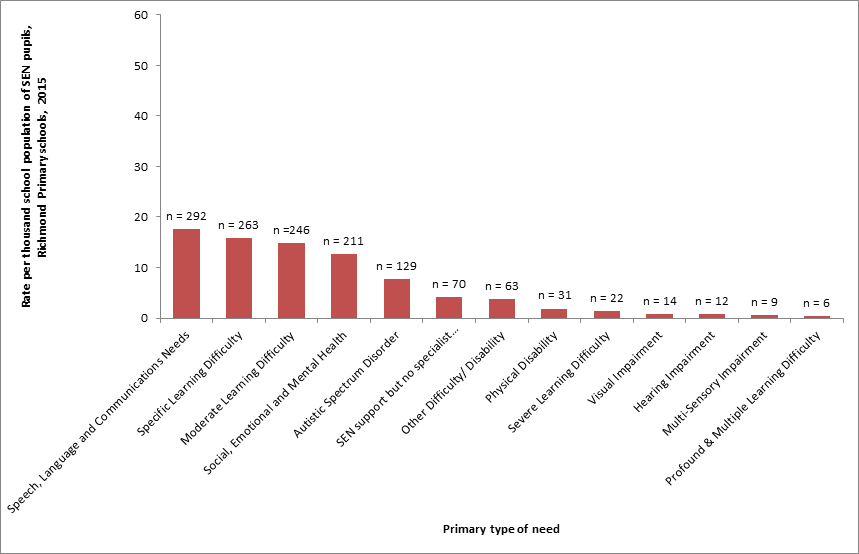
Source: Special educational needs in England: January 2015, from the Department for Education, first published July 2015. Rates taken from School children with special educational needs, from the National Child and Maternal Health Intelligence Network.
Notes: State primary schools includes all primary academies, including free schools & middle schools as deemed.
The figure above shows that the most common primary SEN needs in Richmond primary schools are:
- Speech, language & communication (n=292)
- Specific learning disability (n=263)
- Moderate learning disability (n=246)
- Social, emotional & mental health (n=211)
- Autistic spectrum disorder (n=129)
Figure 32: Number of pupils with Special Educational Needs (SEN) by primary type of need: Primary schools – Richmond 2010-2015
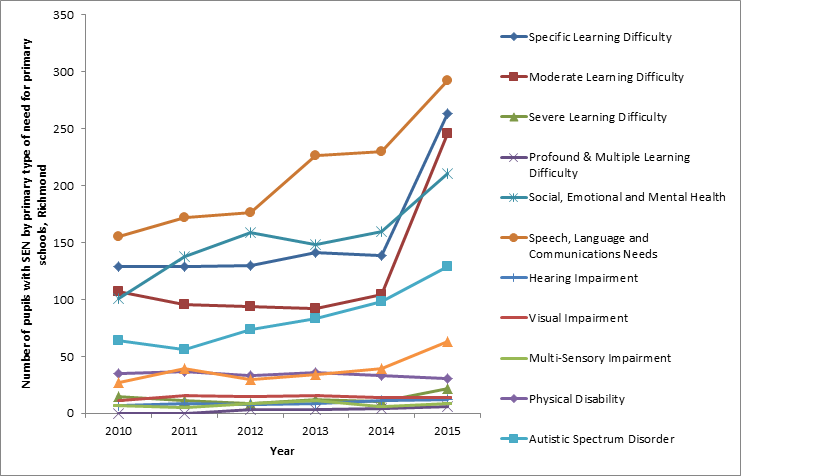
Source: Special educational needs in England, from the Department for Education.
The figure above shows that the following primary SEN needs have increased most substantially in Richmond primary schools since 2010:
- Speech, language & communication
- Specific learning disability
- Moderate learning disability
- Social, emotional & mental health
- Autistic spectrum disorder
These are the same primary needs as those found to make up the largest numbers of current SEN pupils reported in the earlier figure.
Figure 33: Rate per thousand school population of SEN pupils by primary type of need: Secondary schools – Richmond 2015
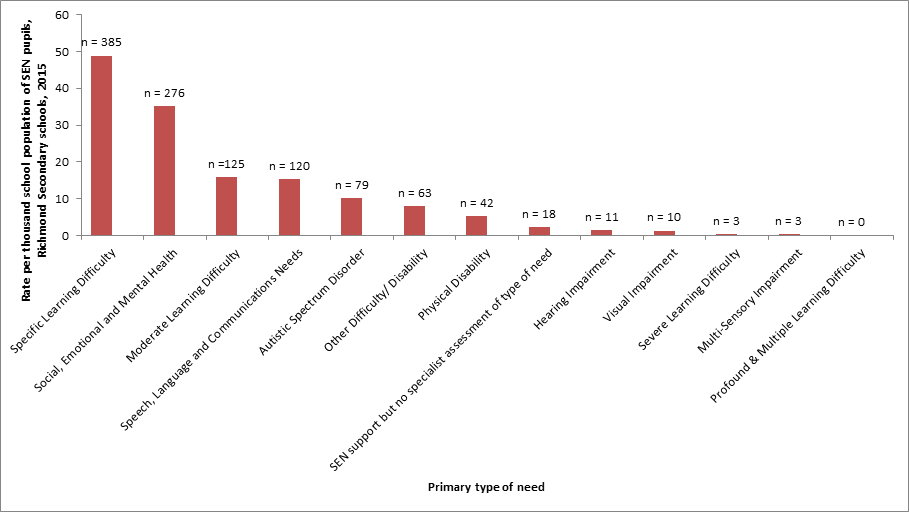
Source: Special educational needs in England: January 2015, from the Department for Education, first published July 2015. Rates taken from School children with special educational needs, from the National Child and Maternal Health Intelligence Network.
Note: State funded secondary schools includes city technology colleges, university technology colleges, studio schools and all secondary academies, including free schools & middle schools as deemed.
The figure above shows that the most common primary SEN needs in Richmond secondary schools are:
- Specific learning disability (n=385)
- Social, emotional & mental health (n=276)
- Moderate learning disability (n=125)
- Speech, language & communication (n=120)
Figure 34: Number of pupils with Special Educational Needs (SEN) by primary type of need: Secondary schools – Richmond 2010 – 2015
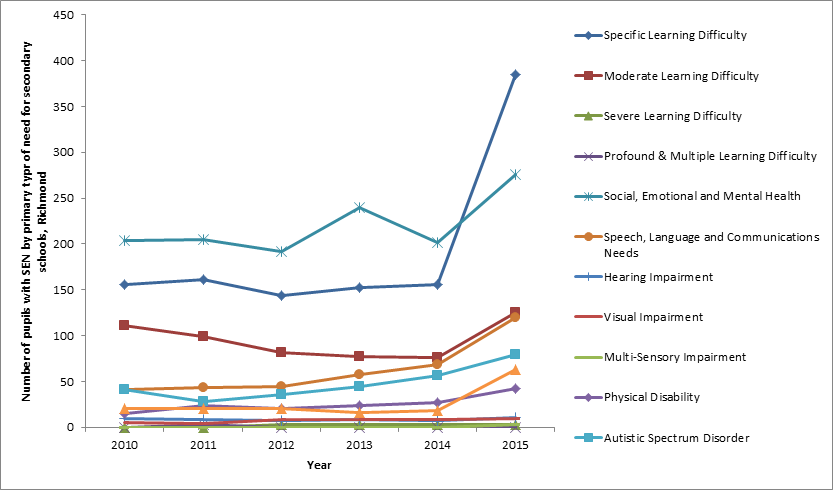
Source: Special educational needs in England, from the Department for Education.
The figure above shows that the following primary SEN needs have increased most substantially in Richmond secondary schools since 2010:
- Specific learning disability
- Social, emotional & mental health
Figure 35: Rate per thousand school population of SEN pupils by primary type of need: Special schools – Richmond 2015
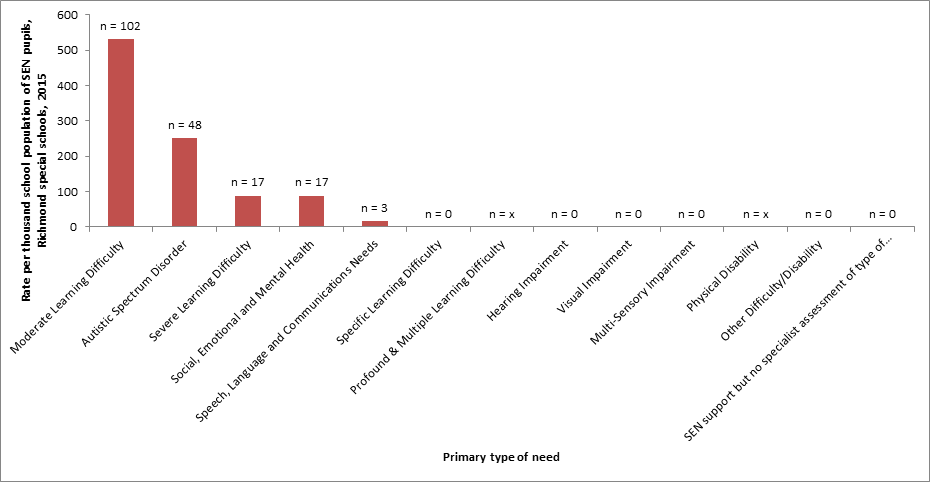
Source: Special educational needs in England: January 2015, from the Department for Education, first published July 2015. Rates taken from School children with special educational needs, from the National Child and Maternal Health Intelligence Network.
Note: Special schools includes maintained and non-maintained special schools and special academies, including free schools. Excludes general hospital schools.
The figure above shows that almost all pupils in Richmond special schools have one of the following four primary SEN:
- Moderate learning disability (n=102)
- Autistic spectrum disorder (n=48)
- Social, emotional & mental health (n=17)
- Severe learning disability (n=17)
Figure 36: Number of pupils with Special Educational Needs (SEN) by primary type of need: Special schools – Richmond 2010-2015
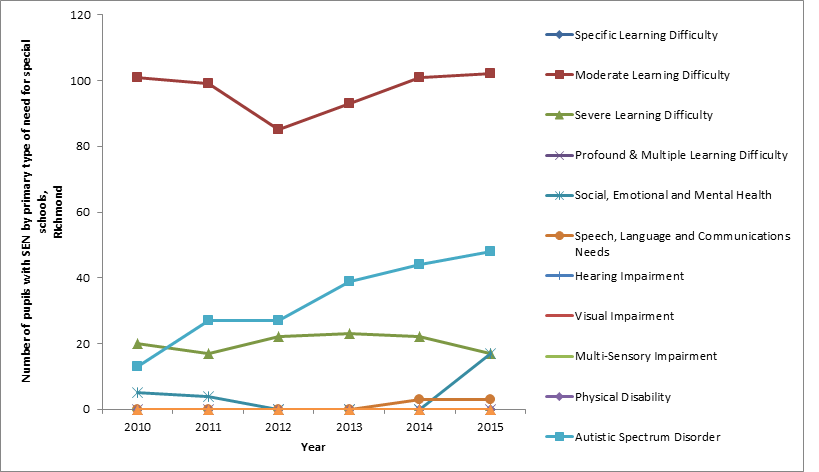
Source: Special educational needs in England, from the Department for Education.
The figure above shows that the largest increase in primary SEN needs in Richmond special schools since 2010 is seen in children with autistic spectrum disorder.
Key findings – SEND provision
Analysis of the numbers and needs of children receiving SEN services found the following.
All Schools
- As of January 2015, in all Richmond schools there were 844 (2.4%) pupils with SEN statements and 3,372 (9.7%) receiving SEN support, a total of 4,216 (12.1%). Comparison to other areas suggests that:
- Levels of SEN statements are similar to other areas, except Wandsworth which has a higher level.
- Levels of SEN support are lower than other areas, except Kingston which has a lower level.
- Levels of overall SEN service provision (i.e. statements+support) are lower than other areas, except Kingston which has a lower level.
- Over the period 2010-2015, levels of all SEN provision in Richmond in all types of schools has remained roughly stable, whereas the other areas have experienced a decline.
- Over the period 2010-2015 the percentage of SEN statements in Richmond has remained steady, while between 2014 and 2015 there was a small decline in the percentage of pupils receiving SEN support services.
State Primary Schools
- As of January 2015, in Richmond state primary schools there were 342 (2.1%) pupils with SEN statements and 1,343 (8.1%) receiving SEN support, a total of 1,685 (10.1%). Comparison to other areas suggests that:
- Levels of SEN statements are higher than other areas.
- Levels of SEN support are lower than other areas.
- Levels of overall SEN service provision (i.e. statements+support) are lower than other areas.
- Over the period 2010-2015, levels of all SEN provision in Richmond in state primary schools has shown a shallow decline compared to steeper declines in other areas.
- Over the period 2010-2015 the percentage of SEN statements in Richmond has risen very slightly and there has been a small decline in the percentage of pupils receiving SEN support services.
State Secondary Schools
- As of January 2015, in Richmond state primary schools there were 286 (3.6%) pupils with SEN statements and 1,014 (12.9%) receiving SEN support, a total of 1,300 (16.5%). Comparison to other areas suggests that:
- Levels of SEN statements are higher than other areas.
- Levels of SEN support are similar to England and London, but lower than Wandsworth and much higher than in Kingston.
- Levels of overall SEN service provision (i.e. statements+support) are similar to those for SEN support above.
- Over the period 2010-2015, levels of all SEN provision in Richmond state secondary schools, like other areas, has shown a steady decline.
- Over the period 2010-2015 the percentage of SEN statements in Richmond has remained steady and there has been a substantial decline in the percentage of pupils receiving SEN support services.
Needs of Children Receiving SEN Services
- In Richmond primary schools the most common SEN needs are:
- Speech, language & communication (n=292)
- Specific learning disability (n=263)
- Moderate learning disability (n=246)
- Social, emotional & mental health (n=211)
- Autistic spectrum disorder (n=129)
- In Richmond primary schools the following primary SEN needs have increased most substantially over the period 2010-2015:
- Speech, language & communication
- Specific learning disability
- Moderate learning disability
- Social, emotional & mental health
- Autistic spectrum disorder
- In Richmond secondary schools the most common primary SEN needs are:
- Specific learning disability (n=385)
- Social, emotional & mental health (n=276)
- Moderate learning disability (n=125)
- Speech, language & communication (n=120)
- In Richmond secondary schools the following primary SEN needs have increased most substantially over the period 2010-2015:
- Specific learning disability
- Social, emotional & mental health
- Speech, language & communication
- Specific learning disability
- Moderate learning disability
- Social, emotional & mental health
- Autistic spectrum disorder
- In Richmond Special Schools almost all pupils have one of the following four primary SEN needs:
- Moderate learning disability (n=102)
- Autistic spectrum disorder (n=48)
- Social, emotional & mental health (n=17)
- Severe learning disability (n=17)
In Richmond special schools the largest increase among primary SEN need categories over the period 2010-2015 was seen in children with autistic spectrum disorder.
7 Local Picture: Outcomes
Introduction
The following sections compare available outcome measure data for children and young people receiving SEND services with those not receiving them. Current and historic data (where available) for these population outcomes are presented for Richmond and the selected comparator areas in the following sections.
The outcome measures included are:
- Early years & foundation stage development
- School year 1 phonics decoding attainment
- School key stage 2 level 4 attainment
- GCSE attainment
- School absence
- School exclusion
- Children (aged 16-17) in education or training
Early years & foundation stage: Levels of development
Table 23: Number and % of pupils achieving a good level of development 2014
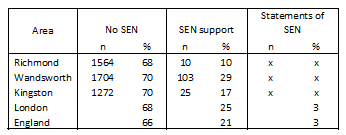
Source: EYFSP attainment by pupil characteristics: 2013 to 2014, from the Department of Education, first published Nov 2014.
Notes:
- x indicates suppressed data due to small numbers.
- A pupil achieving at least the expected level in the ELGs within the three prime areas of learning and within literacy and numeracy is classed as having “a good level of development”.
- Only includes pupils with a valid result for every achievement scale.
- Includes all providers of state-funded early years education (including academies and free schools), private, voluntary and independent (PVI)
The table above shows substantial deficit in good development between no SEN and SEN supported pupils in all comparison areas, and the gap is largest in Richmond (58 percentage points). However it is important to note that the results of only 10 children are included for Richmond schools.
Figure 37: % of pupils achieving a good level of development by SEN: Richmond 2009-2014
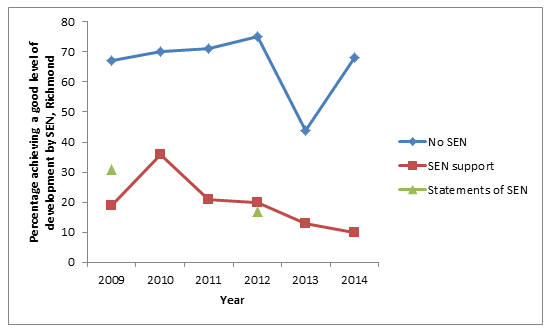
Source: EYFSP attainment by pupil characteristics, from the Department of Education.
The figure above shows that the level of good development in Richmond pupils receiving SEN support has declined since 2010.
School Year 1: Phonics decoding attainment
Table 24: Number & % of year 1 pupils meeting the expected standard of phonic decoding by SEN 2014
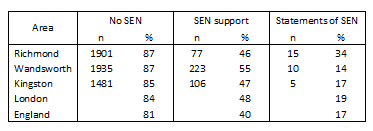
Source: Phonics screening check and Key stage 1 assessments: England 2014 from the Department of Education first published Sept 2014.
The table above shows substantial deficits in standards of phonics decoding between no SEN, SEN support, and SEN statement year 1 pupils in all comparison areas. In Richmond the level of deficit in SEN support pupils is similar to the other areas, and in SEN statement pupils is noticeably smaller.
Figure 38: Percentage of year 1 pupils meeting the expected standard of phonic decoding by SEN: Richmond 2012-2014
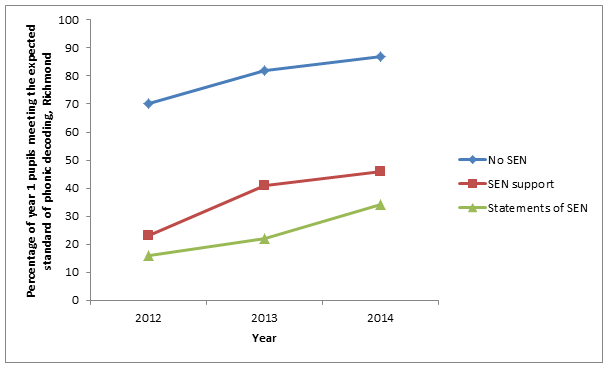
Source: Phonics screening check and Key stage 1 assessments, from the Department of Education.
The figure above shows that improvements occurred in the standards of phonics decoding in Richmond year 1 pupils receiving SEN support and with SEN statements between 2012 and 2014.
Table 25: Number & % of achievements at level 4 or above in Key stage 2 by SEN provision 2014
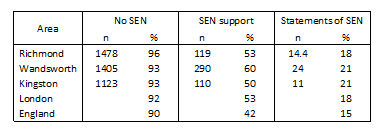
Source: National curriculum assessments at key stage 2, 2014 (revised), from the Department of Education, last updated May 2015.
The table above shows substantial deficits in level 4 or above achievement at Key Stage 2 between no SEN, SEN support, and SEN statement in all comparison areas. In Richmond, the level of deficit in SEN support pupils is similar to some of the comparison areas, but lower than England and greater than Wandsworth; and in SEN statement pupils is similar to some areas, but slightly greater than in Wandsworth and Kingston (n.b. only small numbers pupil results are reported).
Figure 39: Percentage of achievements at level 4 or above in Key stage 2 by SEN provision: Richmond 2009-2014
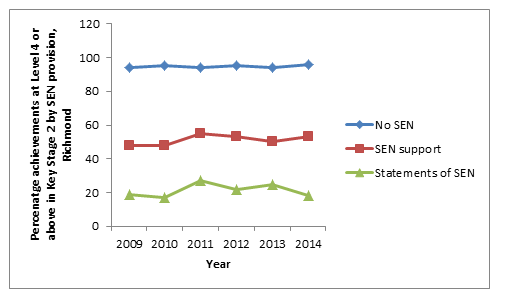
Source: National curriculum assessments at key stage 2, 2014, from the Department of Education.
The figure above shows that attainment of level 4 or above achievement at Key Stage 2 in all pupil groups in Richmond year 1 pupils remained broadly stable between 2009 and 2014.
GCSE attainment
Table 26: Number & % of achievements at GCSE 5+ A* – C grades by SEN provision 2014
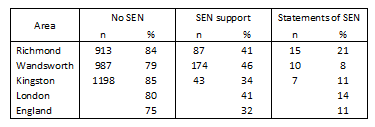
Source: GCSE and equivalent attainment by pupil characteristics: 2014, from the Department of Education, last updated Feb 2015.
The table above shows substantial deficits in GCSE attainment between no SEN, SEN support, and SEN statement in all comparison areas. In Richmond, the level of deficit in SEN support pupils is larger than Wandsworth and smaller than Kingston; and in SEN statement pupils is lower than in the other areas (n.b. only small numbers pupil results are reported).
Figure 40: Number & % of achievements at GCSE 5+ A* – C grades by SEN provision: Richmond 2010-2014
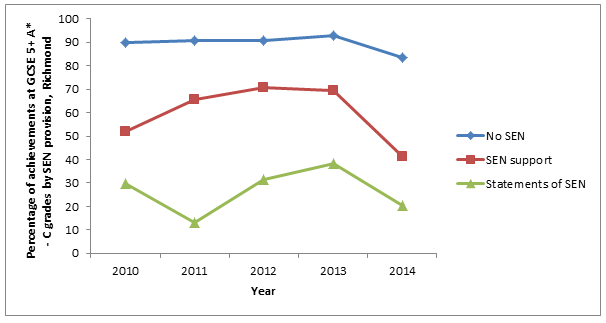
Source: GCSE and equivalent attainment by pupil characteristics, from the Department of Education.
The figure above shows that GCSE attainment levels in SEN support and SEN statement pupils in Richmond have declined over the period 2010 to 2014.
School absence
Table 27: Number & % defined as persistent absentees: 2012 & 2013
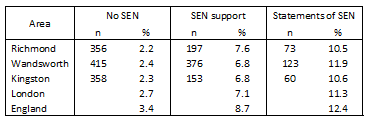
Source: Children with special educational needs: an analysis – 2014 (local authority tables), from the Department of Education, last updated Sept 2014.
Note: Persistent Absentees are defined as having an overall absence rate of around 15 per cent or more.
The table above shows that levels of school absence are higher in SEN support and SEN statement pupils than in no SEN in all comparison areas. In Richmond, absence levels are slightly higher than most comparison in SEN support pupils, and lower than all areas in SEN statement pupils.
No historic trend data is available for this measure.
School exclusion
Table 28: Number & % receiving at least one fixed term exclusion, 2012 & 2013 (six half terms)
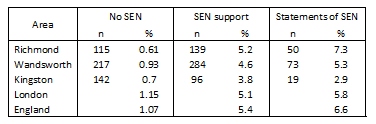
Source: Children with special educational needs: an analysis – 2014 (local authority tables), from the Department of Education, last updated Sept 2014.
The table above shows that levels of school exclusion are higher in SEN support and SEN statement pupils than in no SEN in all comparison areas. In Richmond, exclusion levels are slightly higher than in Wandsworth and Kingston in SEN support pupils, and higher than all areas in SEN statement pupils.
No historic trend data is available for this measure.
Young people ages 16-17: Not in education & training
Table 29: Number & % of 16-17 year olds not in education and training by SEND, 2015
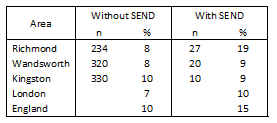
Source: Participation in education and training: local authority figures, from the department of Education, first published Oct 2013.
Note: With SEND includes young people with SEN statement at end of compulsory education & with a Learning Disability Assessment (LDA) or ECHP.
Figure 41: % of 16-17 year olds not in education and training by SEND: Richmond 2013-2015
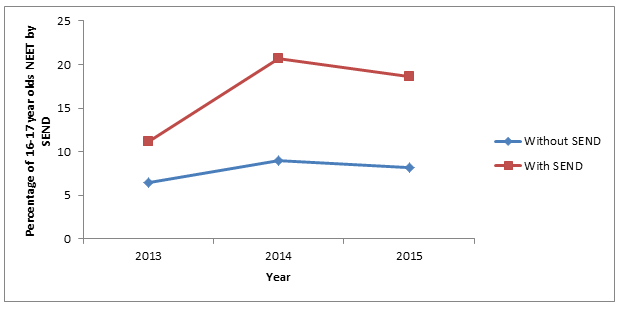
Source: Participation in education and training: local authority figures, from the department of Education, first published Oct 2013.
The table and figure above show that the deficit between young people aged 16 to 17 with and without SEND not in education or training is greater in Richmond than in the other areas, and that this has widened over the period 2013 and 2015.
Key findings – Outcomes
- Levels of Early Years and Foundation stage learning development classified as Good are substantially lower among children receiving SEN Support compared to those receiving no SEN services in Richmond schools. Also, over the period 2009-2014 levels have declined in the children receiving SEN support, and the scale of the gap with children receiving no SEN services is larger than in other areas (note: this finding is based on analysis of small numbers of SEN support children).
- Levels of phonics decoding among Year 1 pupils with SEN statements and receiving SEN support is substantially lower than in those receiving no SEN services in Richmond schools. Over the period 2012-2014 improvements in levels have occurred in children receiving SEN services at a similar rate to those receiving no SEN services.
- Attainment of level 4 Key Stage 2 learning outcomes is substantially lower in children receiving SEN services compared to those receiving no SEN services in Richmond schools. Over the period 2009-2014 the gap in attainment has remained broadly stable.
- Attainment of 5+ A*-C grade GCSEs is lower in children receiving SEN services compared to those receiving no SEN services in Richmond schools. Over the period 2010-2014 attainment levels have declined both in children with SEN statements and receiving SEN support.
- Levels of persistent school absence are higher in SEN support and SEN statement pupils than in no SEN service pupils in Richmond schools. Compared to other areas, levels in Richmond are generally slightly higher in SEN support pupils and lower in SEN statement pupils.
- Levels of school exclusion are higher in SEN support and SEN statement pupils than in no SEN in Richmond schools. Compared to other areas, exclusion levels are slightly higher than in Wandsworth and Kingston in SEN support pupils, and higher than all areas in SEN statement pupils.
- Levels of young people (aged 16-17) not in education or training are higher in those who had a SEN statement when leaving school or with a Learning Disability Assessment (LDA) in Richmond. Compared to other areas, the difference in Richmond is larger and has widened over the period 2013-2015.
8 Discussion/Conclusion
Providing children with long-term health problems and disabilities, and their families, with appropriate and effective support services is an important public health responsibility of local councils and their partners. Such services seek to both provide necessary everyday support to overcome health problems and disability to enable access to educational and social development, and optimise longer term outcomes and opportunities.
Given their length of lifetime ahead, investment in cost effective services to achieve these aims is likely to be of substantial long-term economic benefit to health and social providers, and the wider economy.
Inherent limitations exist in relation to data availability and feasibility of methods of analysis of local population SEND need, which is influenced by a variety of complex, multi-factorial, and interrelated range of personal and family characteristics and disabilities. Consequently the valid identification of population determinants of SEND need and accurate modelling of quantified estimates of expected service demand is challenging. Also, this report limits itself to relatively high-level descriptive data analysis across time periods and to a limited number of comparison areas, rather than any more sophisticated and powerful statistical analysis of larger samples of comparison areas or modelling need and appropriate service levels.
However, the available research undertaken elsewhere suggests that a number of population characteristics are associated with levels of SEND need. These include wider family circumstances (e.g. social & economic status, family problems), as well as the occurrence of specific disabilities (e.g. physical disabilities, learning disabilities, sensory & behavioural problems).
Using these and standardised data on current levels of service access and outcomes, this report seeks to contribute to ensuring that commissioned levels of SEND service access in Richmond are appropriate to apparent levels of local need in resident and school populations.
The report’s findings suggest that while comparative levels of need are generally lower than other areas, the scale of SEND need in Richmond is likely to remain substantial, for instance almost 3,000 children (aged <16) are estimated to live in poverty, almost 1500 are assessed as Children In Need, around 1,500 children and young people (aged <25) have limiting long-term health problems or disabilities, almost 2,000 children (aged <16) are estimated to have a mental health disorder, around 500 have a moderate physical disability, and over 100 have autistic spectrum disorders.
The lack of precise metrics to determine levels of SEND need and appropriate service levels, and the fact that local authorities act both as ‘gate keepers’ to and commissioners of SEND services, means that substantial uncertainty prevails in determining the appropriateness of local service levels in Richmond and elsewhere.
However, while recognising these limitations, the report’s findings appear to indicate that levels of SEN statements are higher or similar to most other areas included for comparison in the analysis, levels of SEN support are lower or similar to most other areas included, and levels of overall SEN services (i.e. statements+support) are lower than or similar to other areas. Over the period 2010-2015, overall SEN provision, possibly the best measure of the total level of local met need, has remained broadly stable, compared to declines elsewhere. However, this finding is not consistent across all school types and consequently it is important to consider access to SEND services within and between different elements of the system. This more micro and system function question is beyond the scope of this report.
Findings in relation to historic trends in types of SEN needs show how changes in the nature of need and demands on local services can change relatively quickly. Consequently it is important that trends are monitored and the system has capacity to adapt to emerging requirements. Again, these micro service planning requirements are beyond the scope if this report.
Furthermore, in respect to outcomes, in Richmond and elsewhere, substantial outcome gaps persist between SEN and non-SEN pupils and young people across a set of comprehensive measures. While determining specific outcome benchmarks for SEN services, or gap reduction targets is a wider research and policy question beyond the scope of this report, it is important to note that gaps in Richmond have generally remained stable (e.g. level 4 Key Stage 2 learning outcome) or worsened (e.g. 5+ A*-C grade GCSEs, young people [aged 16-17] not in education or training), rather than having improved over the time periods analysed.